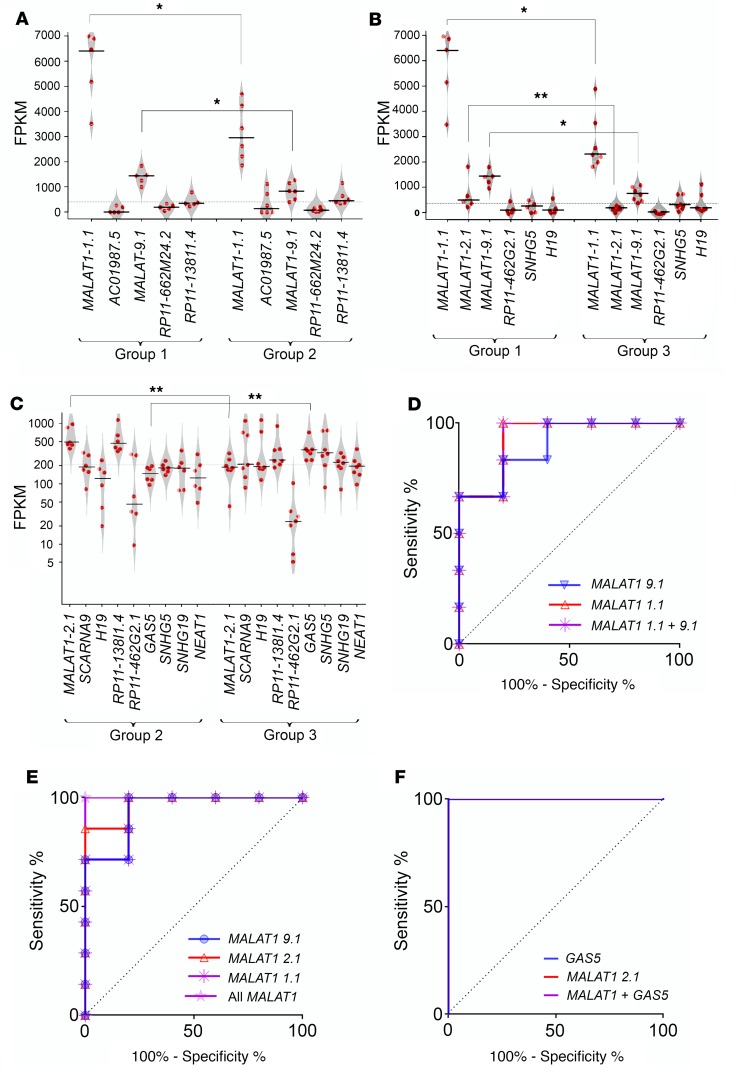
Figure 2. Key lncRNAs identified in islet quality stratified discovery sample set.
Penalized regression analysis and bootstrapping were performed on the (6983) annotated lncRNAs and the identified lncRNAs across all group-wise comparisons (n = 18 human islet samples, categorized into 3 groups) as presented in A–C: (A) group 1 versus group 2, (B) group 1 versus group 3, and (C) group 2 versus group 3. (See Supplemental Table 4 for details; unequal-variance Student’s t test was used. Note: The lncRNA AC010987.5 was present at very low FPKM and hence is not shown in C.) *P < 0.05; **P < 0.01. Each red dot represents individual islet preparation. The horizontal line represents the mean while the polygons represent the estimated density of data (scatter plot). Two-tailed distribution, with 2-sample unequal-variance Student’s t test, was used to identify the difference for each lncRNA between each group-wise comparison. ROC curves: (D) group 1 versus group 2: MALAT1-1.1, MALAT1-9.1, and both MALAT1 variants (9.1 + 1.1); (E) group 1 versus group 3: MALAT1-1.1, MALAT1-2.1, MALAT1-9.1, and all the above 3 MALAT1 variants (1.1 + 2.1 + 9.1); (F) group 2 versus group 3: ENST00000450589.5 (GAS5), MALAT1-2.1, and both; GAS5 + MALAT1-2.1.

