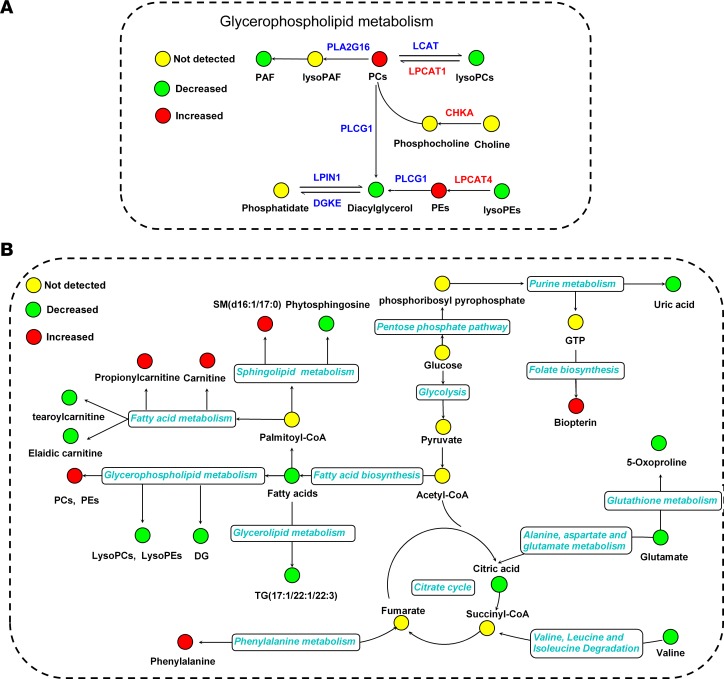
Figure 4. Schematic overview of the metabolites and major metabolic pathways, as well as pathway-related enzyme surrogates iterations, in aGvHD patients at day +15 after alloHSCT.
(A) Description of the glycerophospholipid metabolism pathway related metabolites and enzyme surrogate genes changes in aGvHD. (B) Dysregulation of metabolic pathways in aGvHD. The enzyme surrogates are shown in color: red text represents increased expression of enzyme surrogates, and blue text represents decreased expression of enzyme surrogates. The yellow circles represent no detected metabolites; green circles represent decreased metabolites; and red circles represent increased metabolites.

