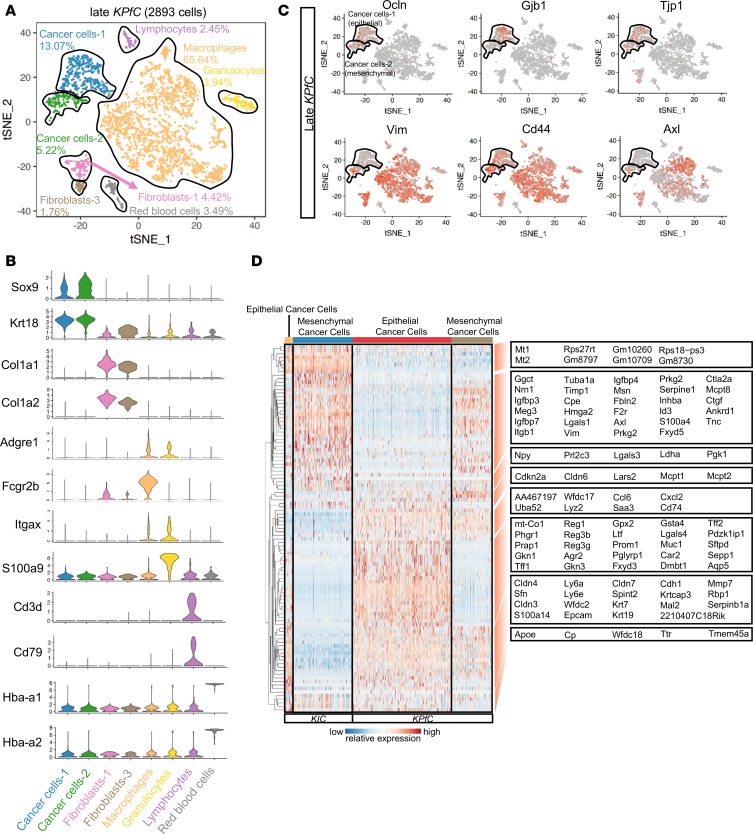
Figure 3. Comparison between cancer cells of KIC and KPfC tumors.
(A) tSNE plot of the late KPfC lesion displaying 2893 cells and 8 distinct cell populations (tumor analyzed from 1 mouse). (B) Stacked violin plots showing representative marker gene expression for each of the cell populations seen in the late KPfC lesion. (C) Single-gene tSNE plots of the KPfC tumor displaying the presence of epithelial markers (Ocln, Gjb1, and Tjp1) in the epithelial cancer cell population (top black-outlined population) and mesenchymal markers (Vim, Cd44, and Axl) in the mesenchymal cancer cell population (bottom black-outlined population). (D) Single-cell profiling heatmap comparing all cancer cells in late KIC versus all cancer cells in late KPfC. Each column represents an individual cell, and each row is the gene expression value for a single gene.

