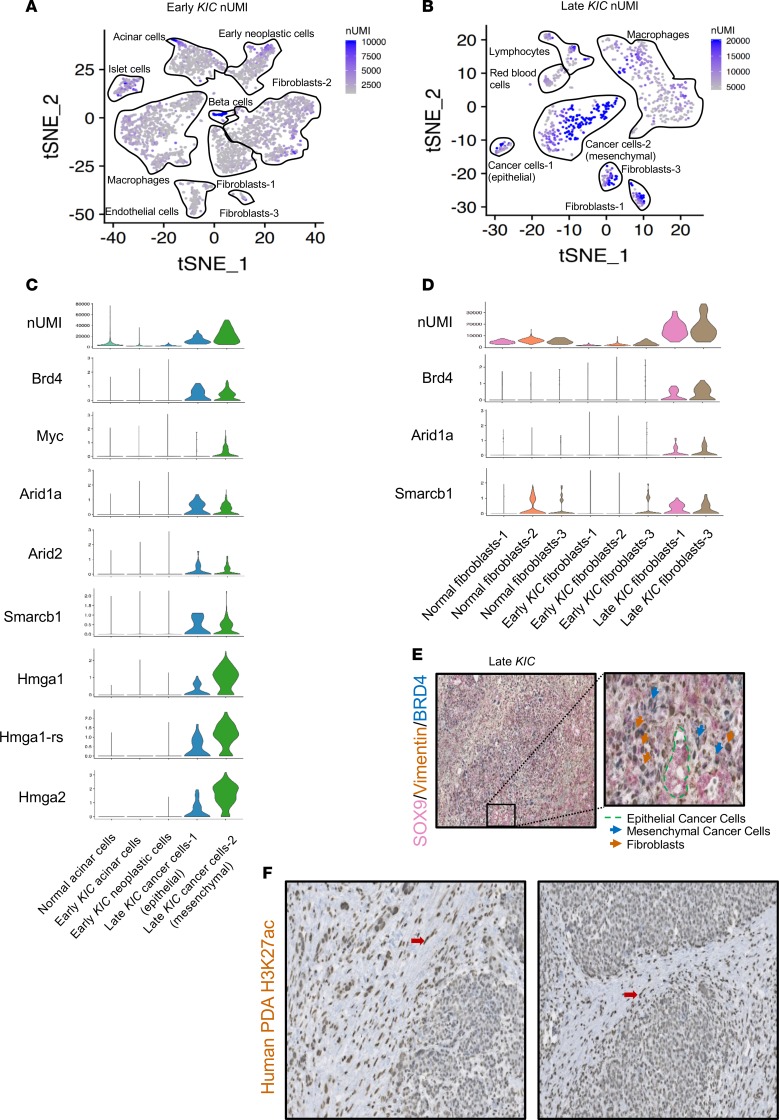
Figure 6. Analysis of transcriptional activity in different stages of PDA reveals differential epigenetic and transcriptional activity in distinct tissue compartments.
tSNE plot of number of unique molecular identifiers (nUMIs) in the (A) early and (B) late KIC. (C) Violin plots of epigenetic regulatory genes in the epithelial cell populations of the normal pancreas, early KIC, and late KIC. (D) Violin plots of epigenetic regulator genes in the normal, early fibroblast, and late fibroblast populations showing their upregulation in CAFs. (E) Sequential triple immunohistochemical staining on the same late KIC tumor section for cancer cells (SOX9, shown in pink), mesenchymal cells (vimentin, shown in brown), and increased enhancer activity (BRD4, shown in blue). Well-differentiated ductal epithelium stained solely for SOX9 (green outline). Mesenchymal cancer cells (blue arrows) and CAFs (brown arrows). Original magnification ×10. Inset magnification ×30. (F) Immunohistochemical analysis of human PDA whole tissue sections using the H3K27ac antibody. These representative figures from 2 human PDAs demonstrate the 3+/3+ staining in the stromal fibroblasts (red arrows) with 1+–2+ staining in the cancer epithelium (original magnification, ×20).

