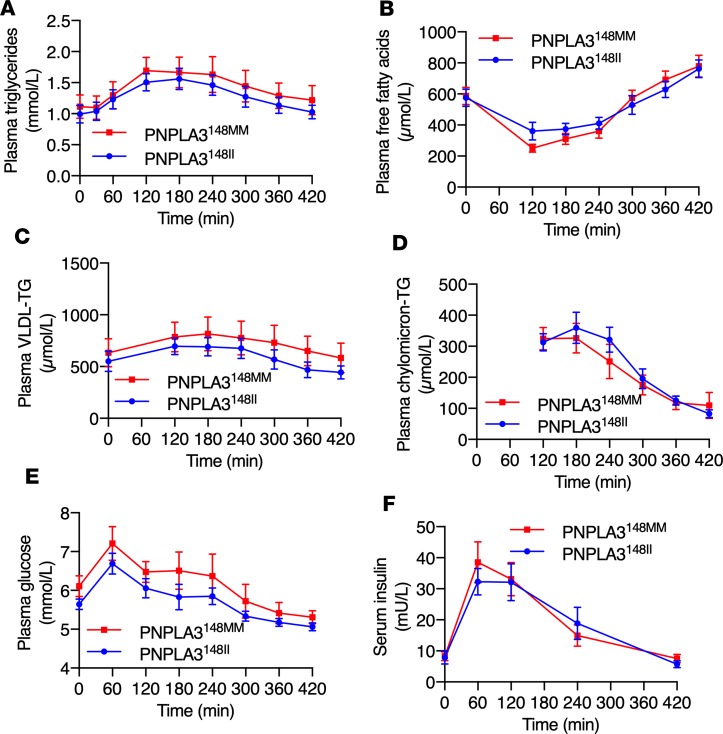
Figure 1. Similar total concentrations of circulating lipids, glucose, and insulin in the PNPLA3148MM vs. PNPLA3148II groups.
Concentrations of (A) plasma TGs, (B) free fatty acids, (C) VLDL-TG, (D) chylomicron-TG, (E) glucose, and (F) serum insulin in the PNPLA3148MM and PNPLA3148II groups in the fasting state (0 minutes) and during the postprandial period. Data are shown as mean ± SEM. The blue lines and circles denote the PNPLA3148II (n = 14) group, and the red lines and squares denote the PNPLA3148MM (n = 12) group. There were no significant differences between the groups as determined using 2-way ANOVA.

