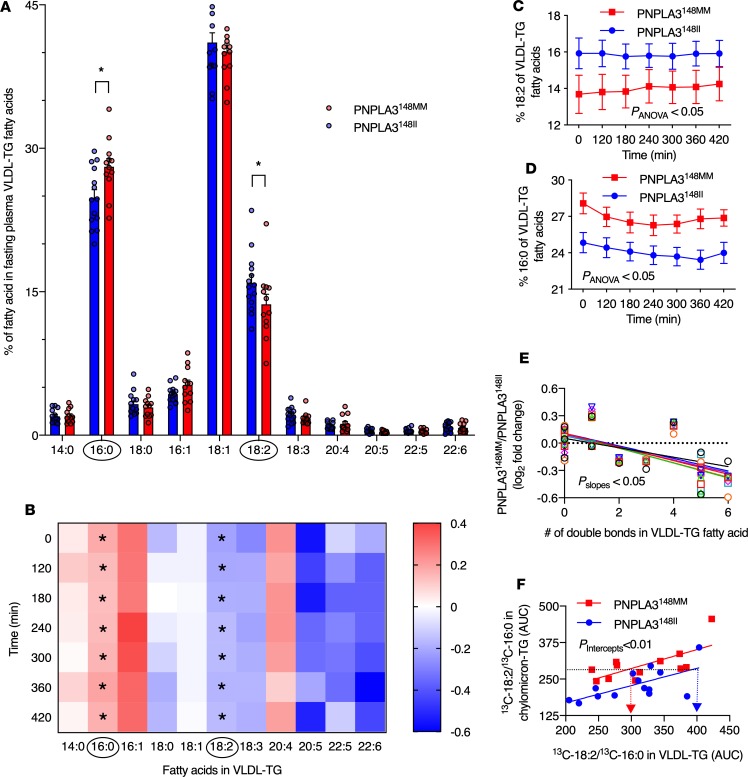
Figure 3. Differences in the composition and handling of VLDL-TG fatty acids in the PNPLA3148MM vs. the PNPLA3148II groups.
(A) Percentage of distinct fatty acids of total unlabelled fatty acids in VLDL-TG in the PNPLA3148MM (red bars, n = 12) and PNPLA3148II (blue bars, n = 14) groups in the fasting state. (B) Fold change in the percentage of distinct fatty acids of total unlabeled fatty acids in VLDL-TGs in the PNPLA3148MM (n = 12) vs. the PNPLA3148II (n = 14) groups in the fasting state (0 minutes) and during the postprandial period. The x-axis denotes distinct fatty acids, and y-axis denotes postprandial time. Each square represents log2 fold-change of the percentage of a distinct fatty acid of total fatty acids in VLDL-TG in the PNPLA3148MM (n = 12) vs. the PNPLA3148II (n = 14) groups at that time point. (C and D) Percentage of unlabeled polyunsaturated fatty acid linoleate (18:2) (C) and saturated fatty acid palmitate (16:0) (D) of total fatty acids in VLDL-TG in the PNPLA3148MM (red squares and lines, n = 12) and PNPLA3148II (blue circles and lines, n = 14) groups in the fasting state and during the 420-minute postprandial period. (E) Linear regression lines between the number of double bonds in VLDL-TG fatty acids and the log2 fold-change of absolute concentrations of corresponding VLDL-TG fatty acid in the PNPLA3148MM (n = 12) vs. the PNPLA3148II (n = 14) groups in the fasting state (0 min; black circles) and at 120 minutes (red squares), 180 minutes (green triangles pointing up), 240 minutes (blue triangles pointing down), 300 minutes (purple diamonds), 360 minutes (orange circles), and 420 minutes (turquoise squares). (F) Ratio of 13C-18:2 to 13C-16:0 fatty acids in plasma VLDL-TG related to the corresponding ratio in the chylomicron precursor pool in the PNPLA3148MM (red squares and lines, n = 12) and the PNPLA3148II (blue circles and lines, n = 14) groups. Data are shown as mean ± SEM. *P < 0.05. Significance was determined using 2-tailed Student’s t test for unpaired data, 2-way ANOVA, and linear regression as appropriate.

