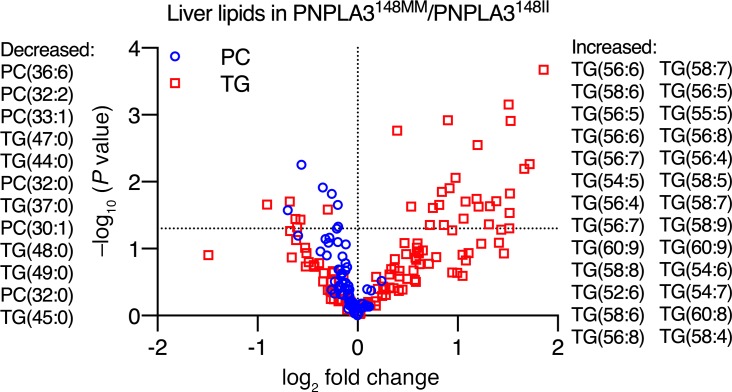
Figure 6. Polyunsaturated TGs are enriched, while PCs are deficient in the human liver in homozygous carriers (PNPLA3148MM) as compared with noncarriers (PNPLA3148II) of the PNPLA3-I148M variant.
The x-axis denotes log2 fold-change in hepatic concentration of a given lipid in PNPLA3148MM (n = 7) as compared with PNPLA3148II (n = 64) group. The y-axis denotes negative logarithm of P value of 2-tailed Student’s t test comparing hepatic concentrations of a given lipid in PNPLA3148MM as compared with PNPLA3148II group. Red squares denote TGs, and blue circles denote PCs. Horizontal dashed line represents –log10(0.05). Each symbol represents distinct hepatic lipid species. Lipid species that were significantly decreased in the PNPLA3148MM as compared with the PNPLA3148II group are listed on the left side of the figure, while those that were increased are listed on the right side in the order of significance. Data in this figure are from separate liver biopsy cohort described earlier (5).

