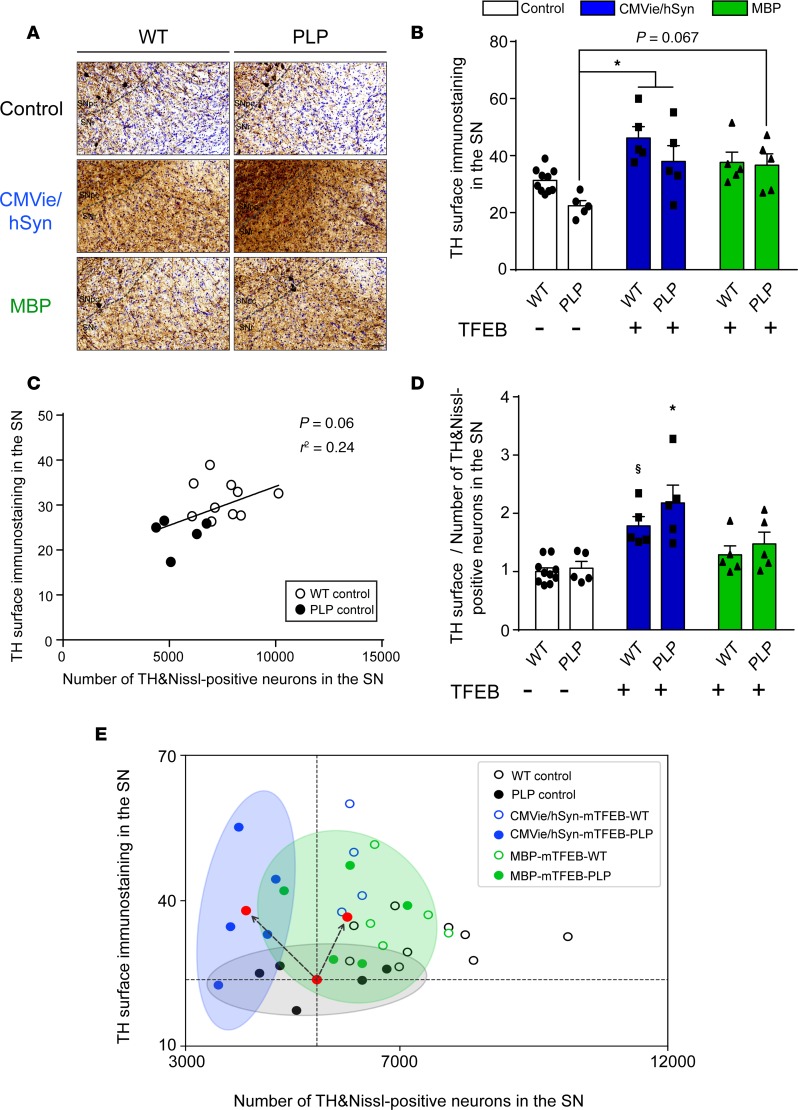
Figure 7. Both oligodendroglial– and neuronal TFEB–targeted overexpression induce neurotrophic effects in the brains of PLP mice.
(A and B) Representative images (A) and quantification (B) of TH-positive immunostaining in the ipsilateral SN of control, CMVie/hSyn-mTFEB–injected, and MBP-mTFEB–injected WT and PLP mice. Scale bar: 50 μm. (C) Linear regression between TH-positive immunostaining and TH- and Nissl-positive cells in the SN of control WT (empty dark dots) and PLP mice (full dark dots). (D) Ratio of TH-positive immunostaining in the ipsilateral SN divided by the number of TH- and Nissl-positive neurons into the ipsilateral SN of control, CMVie/hSyn-mTFEB–injected, and MBP-mTFEB- injected WT and PLP mice. n = 5 per group. White bars, control; blue bars, CMVie/hSyn-mTFEB-HA; green bars, MBP-mTFEB-3×Flag. (E) Scatter plot of the value of TH surface immunostaining and the number of TH- and Nissl-positive neurons into the ipsilateral SN of control, CMVie/hSyn-mTFEB–injected, and MBP-mTFEB–injected WT and PLP mice. Each dot represents 1 animal. Red dot corresponds to the center of mass of each experimental group, and the ellipses represent the 95% CI around the center of mass: PLP control (black); CMVie/hSyn-mTFEB PLP (blue); MBP-mTFEB-PLP (green). Dashed lines are arbitrarily centered on the center of mass of PLP control group to distinguish between neurotrophic effect (toward upper left quadrant), neuroprotection (lower right quadrant), and a combination of both (upper right quadrant) in AAV-injected PLP groups; black arrows represent the direction of the change. Data represent mean ± SEM. Comparisons were made using 2-way ANOVA and Tukey’s correction for multiple comparisons. *P < 0.05 compared with control PLP animals. $P < 0.05 compared with control WT animals.

