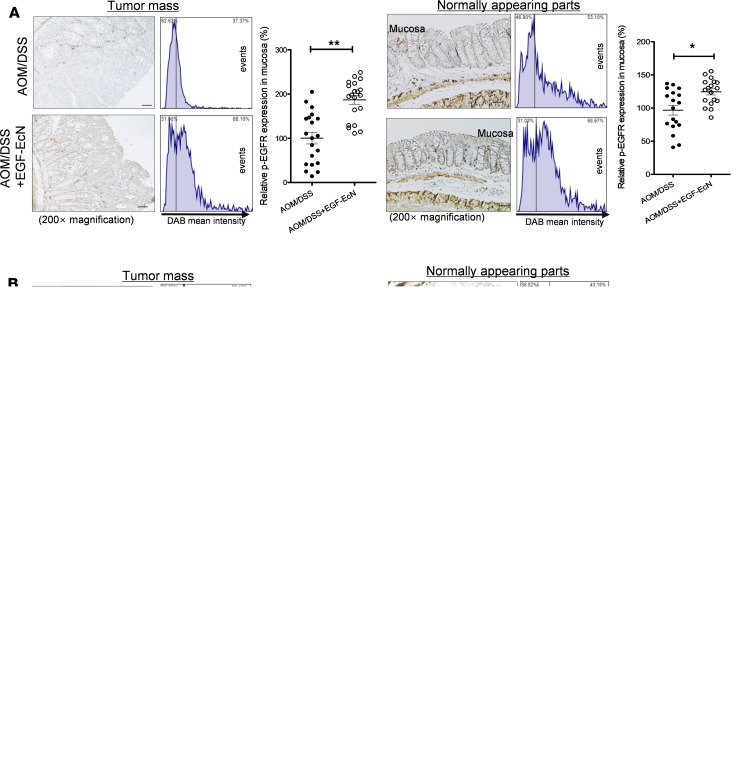
Figure 12. Effects of EGF-EcN on the cell growth signaling in mice with colitis-associated cancer.
Tumors were assessed in C57BL/6 mice using AOM/DSS along with EcN and EGF-EcN treatment as depicted in Figure 9A (n = 10–20). (A) The expression of active EGFR in colons of the AOM/DSS–induced cancer model was compared (original magnification, ×200). Scale bar: 100 μm. Relative density of p-EGFR was measured by using HistoQuest tissue analysis software. (B) The extent of cell proliferation in colons of the AOM/DSS–induced cancer model was determined by measuring the expression of Ki-67 in the tumor mass (original magnification, ×200). Scale bar: 100 μm. Blue arrows indicate high expressions in the cryptic parts. (C) Sox-9 expression in colons of the AOM/DSS–induced cancer model was determined (original magnification, ×200). Scale bar: 200 μm. Each histogram represents events at an increasing DAB level. A quantitative comparison is shown in the right graph (*P < 0.05; **P < 0.01; ***P < 0.001 using 2-tailed, unpaired Student’s t test).

