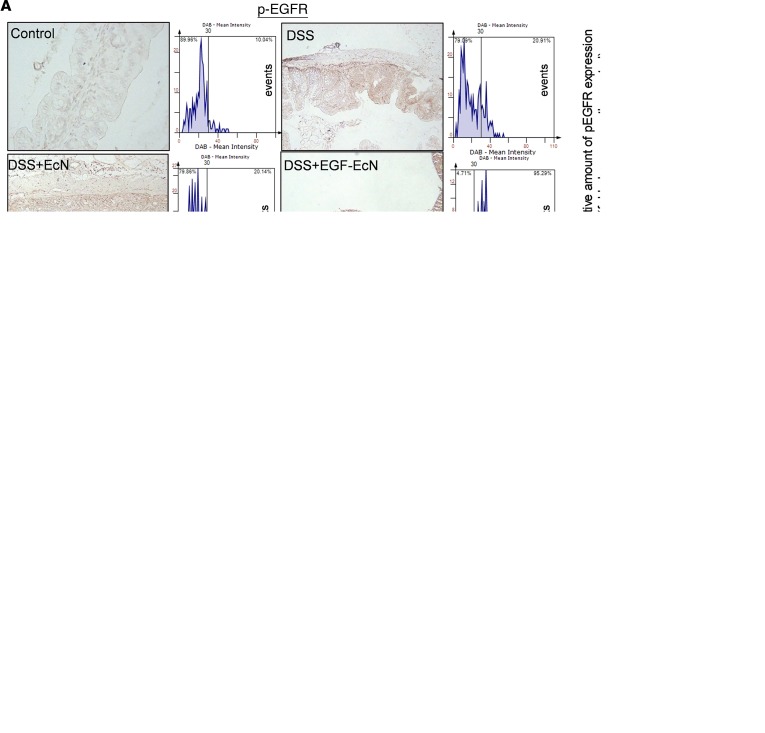
Figure 3. EGF-EcN–mediated actions in EGFR signaling in DSS-induced colitis.
(A–C) Six-week-old female mice were pretreated twice with vehicle, EcN, or EGF-EcN over 7 days (n = 12–15). The mice were then exposed to 3% DSS for 5 days to induce colitis. (A) Insulted colons were analyzed by IHC using the phosphorylated EGFR (p-EGFR) antibody with hematoxylin counterstaining. A microscopy image at original magnification of ×200 is shown at left. The relative density of p-EGFR was measured by using the HistoQuest tissue analysis software (each histogram of events with increasing diaminobenzidine (DAB) levels, described in the Methods section in detail). A quantitative comparison is shown in the right graphs. Scale bar: 100 μm. Results are shown as a box-and-whisker plot (min to max), and different letters represent a significant difference between groups (P < 0.05 using 1-way ANOVA with the Newman-Keuls post hoc test). (B) Each group of mouse colon lysates was subjected to Western blot analysis. The blots are representative of 3 independent experiments. (C) Eight-week-old female C57BL/6 mice were infected with 1 × 10⁹ EcN or EGF-EcN via oral gavage twice at 3-day intervals, and mouse gut was isolated on the third day after the second inoculation. LARD-tagged EGF secreted from the EGF-EcN and activated EGFR were detected in the colonic mucosa. The white arrows indicate EGFR-Tyr1068 (green) in the mucosa, and the numbers in the upper left represent the relative levels of LARD-EGF or p-EGFR. Relative levels of p-EGFR in mucosa were compared in the box-and-whisker plot (min to max) (right), and the asterisks represent a significant difference between 2 groups (***P < 0.001 using 2-tailed, unpaired Student’s t test).

