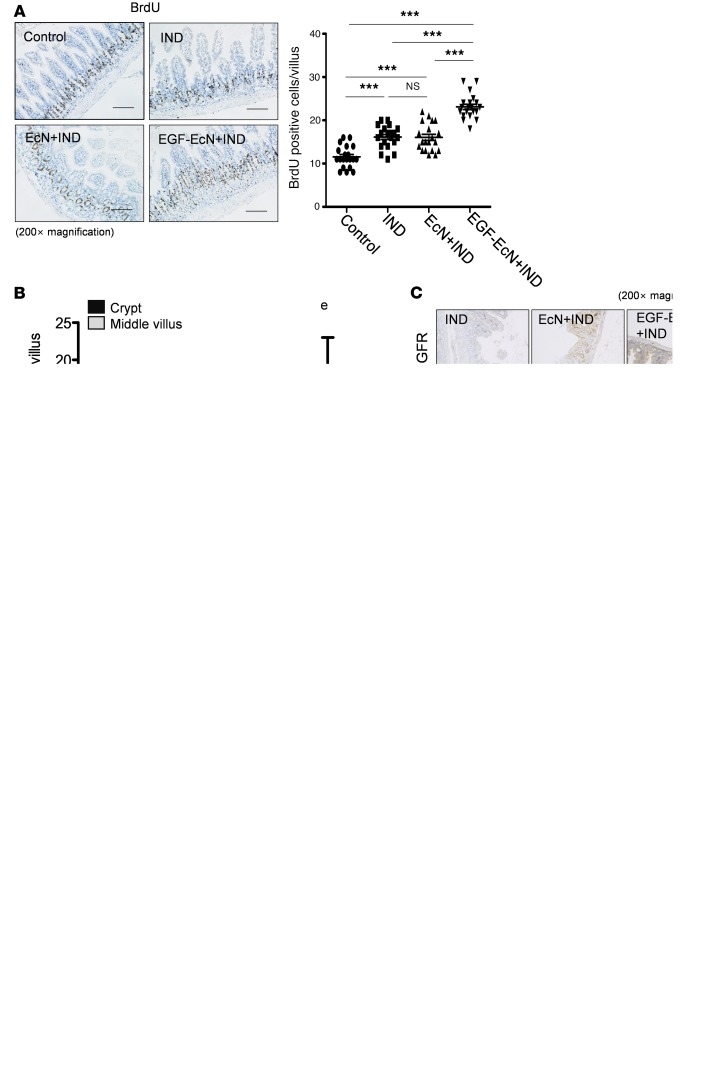
Figure 9. EGF-EcN–mediated actions in cell proliferation in NSAID-induced ulcer.
Ten-week-old male mice were pretreated twice with vehicle, EcN, and EGF-EcN over 7 days (n = 12). The mice were then treated with 30 mg/kg of indomethacin via gavage. (A) Mouse small intestinal tissues were stained for BrdU incorporation while the nuclei were counterstained with hematoxylin (original magnification, ×200). Scale bar: 100 μm. The BrdU-positive cells per villus were counted and the counts compared (***P < 0.001 and ns using 2-tailed, unpaired Student’s t test). (B) The vertical intestinal villus was divided into the crypt part and the middle villus part. BrdU-positive cells in each part were counted per villus. Results are shown as the box-and-whisker plot (min to max), and different letters represent significant differences between groups (P < 0.05 using 1-way ANOVA with the Newman-Keuls post hoc test). The box plots depict the minimum and maximum values (whiskers), the upper and lower quartiles, and the median. The length of the box represents the interquartile range. (C) IHC staining using anti–p-EGFR antibody was assessed under the microscope (original magnification, ×200). Scale bar: 100 μm. (D) Mouse small intestinal tissue was stained to detect Sox-9 protein and counterstained with hematoxylin. Each histogram represents events at an increasing DAB level. Scale bar: 100 μm. A quantitative comparison is shown in the graphs (C and D, *P < 0.05; **P < 0.01; ***P < 0.001 using 2-tailed, unpaired Student’s t test).

