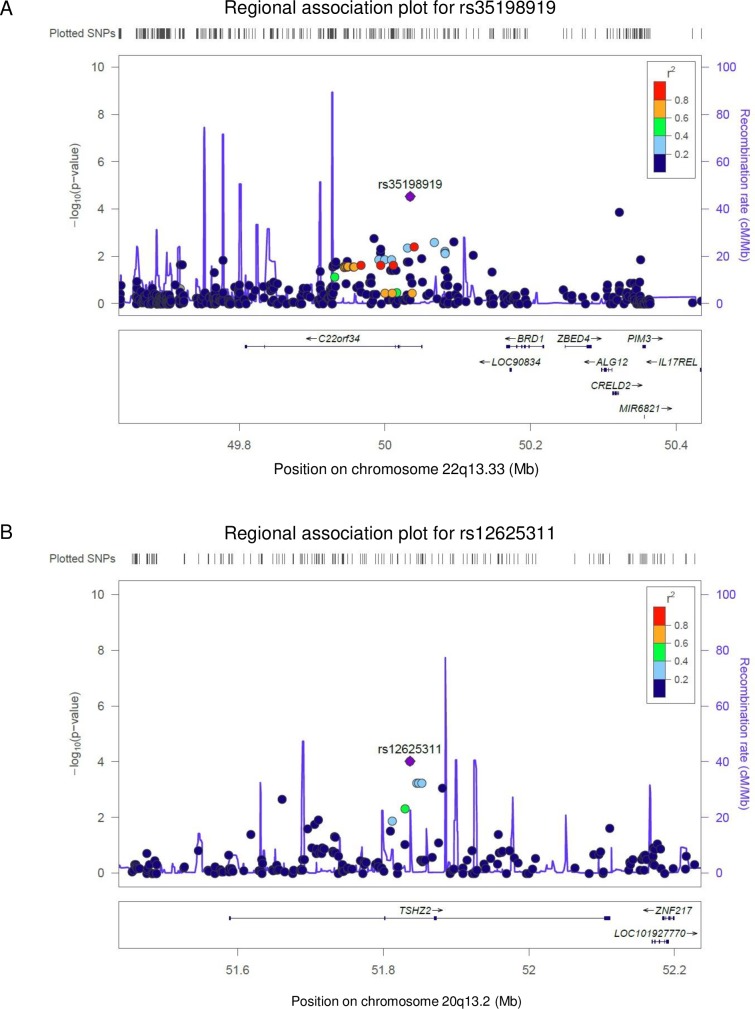
Fig 1. Regional association plots of two SNVs associated with DIILD.
Upper panel; P values of the SNVs are plotted (as–log10P values) against their physical location on chromosome 22 (A) and 20 (B). The genetic recombination rates estimated from the 1,000 Genomes samples (Japanese in Tokyo, JPT + Chinese in Beijing, CHB) are shown with a blue line. SNV color indicates linkage disequilibrium (LD) with rs35198919 (A) and rs12625311 (B) according to a scale from r2 = 0 to 1 based on pairwise r2 values from the Asian (ASN) data from the 1,000 Genomes Project. Lower panel; gene annotations from the University of California Santa Cruz genome browser.

