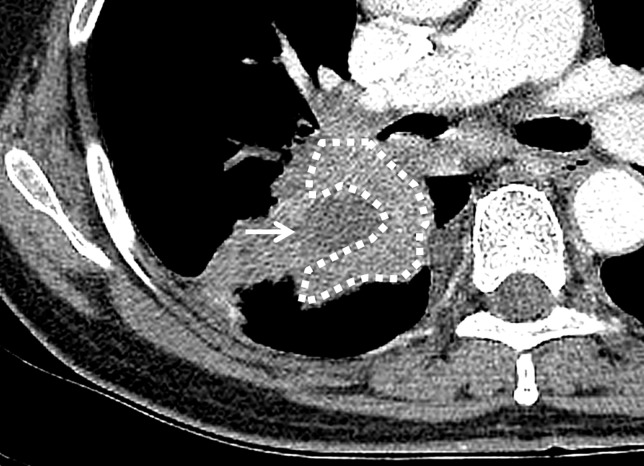
Fig 3. Placement of ROIs within the tumor.
Regions of interest were drawn on the outline of the enhancing portion of the tumor (Polygon with a dashed margin). Areas showing necrosis (arrow) or cavitation were excluded from the ROI. ‘Heterogeneity’ was the standard deviation of CT values of the tumor, and ‘enhancement ratio’ was the mean CT value divided by that of the pectoralis muscle.

