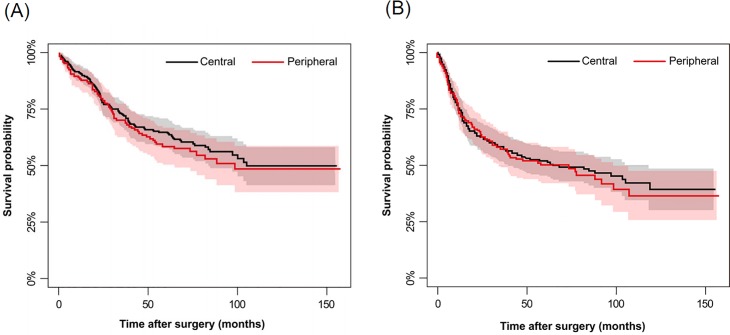
Fig 4. Comparison of calculated OS and DFS using the Kaplan-Meier method according to tumor location.
Overall survival (A) and disease-free survival (B) curves are shown according to tumor location. Survival rates were calculated by Kaplan-Meier method. Standard errors were calculated using Greenwood's formula. No significant difference was observed between the two groups. Gray and pink areas represent the 95% confidence intervals of the black and red plots, respectively.

