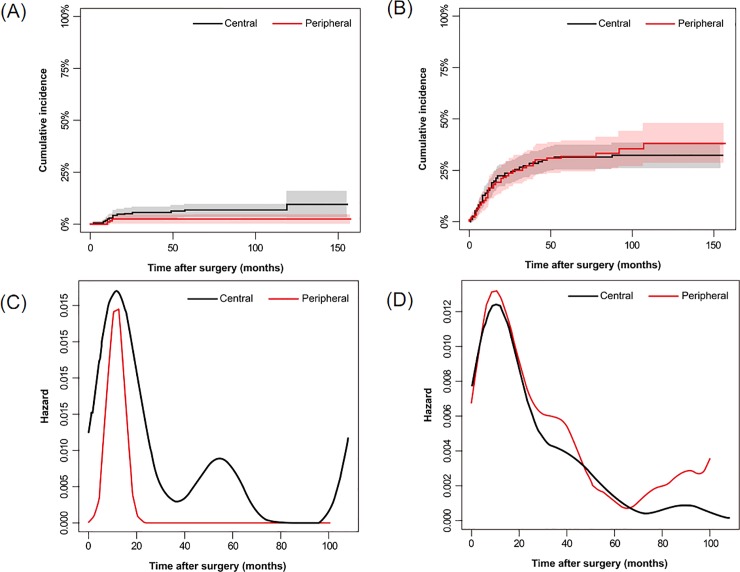
Fig 5.
Comparison of the Cumulative Incidence Rate of Recurrence and Metastasis (A and B) and Recurrence/Metastasis Hazard Rate (C and D) according to Tumor Location. The rate of local recurrence is shown in A and C, and the rate of distant metastasis is shown in B and D. Central tumors had higher peaks on the local recurrence curve, while peripheral tumors were at higher risk of developing distant metastasis 60 months after surgery. Gray and pink areas represent the 95% confidence intervals of the black and red plots in A and B.

