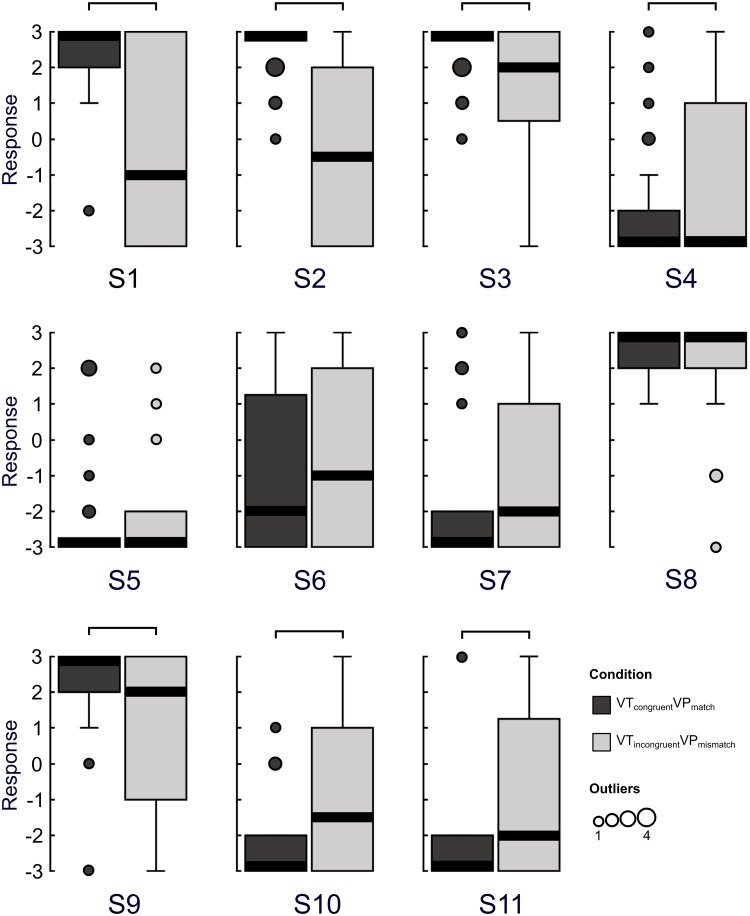
Fig 4. Experiment 2 questionnaire results.
Subjective experience during two levels of multisensory (dis)integration was assessed by comparing agreement with questionnaire statements. Boxplots indicate group responses to each statement for each condition (-3 = strongly disagree, +3 = strongly agree). The solid black lines indicate the median. The number of outliers at any given response value are indicated by the size of the outlying point. The connections above the boxes indicate statistically significant differences between conditions (Wilcoxon signed-rank test, FDR-corrected, p≤.0101).

