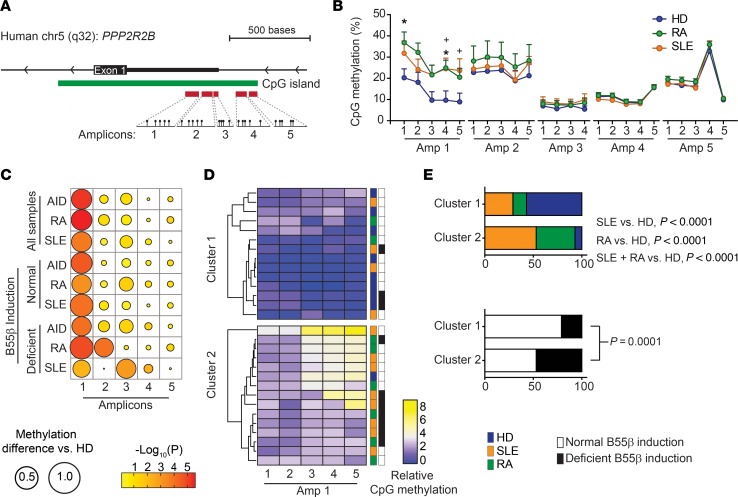
Figure 5. Methylation of discrete cytosines regulates B55β expression in patients with SLE and RA.
(A) Schematic representation of PPP2R2B, indicating the location of the CpG dinucleotides examined by pyrosequencing. (B) Methylation (percentage) of specific CpG dinucleotides in T cells isolated from HDs, patients with SLE, and patients with RA (HD n = 9–20; SLE n = 12–20; RA n = 8–20). RA vs. HD, *P < 0.05; SLE vs. HD, +P < 0.05; 2-way ANOVA with Tukey’s multiple-comparisons test. (C) Differences in the DNA methylation between patients and controls. The diameters of each circle represent the difference between methylation in HDs and the indicated population. The color of each circle indicates the P value of the corresponding comparison. Large differences were found in Amp 1. In addition, significant methylation differences were found in Amp 2 in patients with RA and in Amp 3 in patients with SLE. (D) Heatmap showing relative methylation (fold change over the mean of HDs) of the CpG dinucleotides from Amp 1. Samples were ordered by unsupervised clustering. The colored boxes on the right side of the heatmap indicate whether the sample corresponds to an HD or a patient; the black and white boxes indicate B55β induction after cytokine withdrawal. (E) Segregation of HDs and patients in clusters 1 and 2 (upper) and segregation of individuals with normal or defective B55β induction (lower). P values were calculated using χ2 test.

