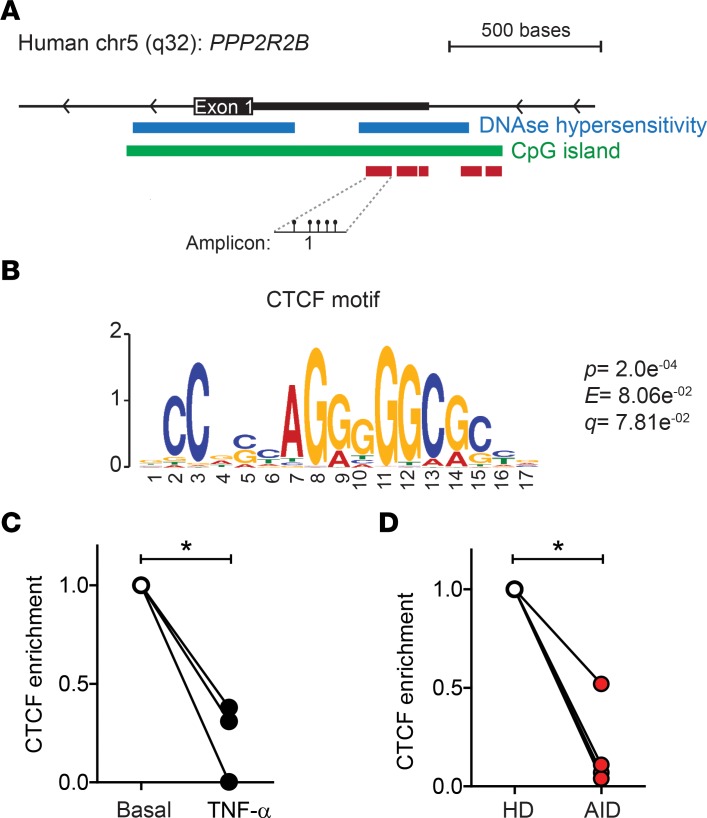
Figure 8. CTCF binding to PPP2R2B is decreased in T cells of patients with AID.
(A) Schematic representation of PPP2R2B, indicating the location of the region that was analyzed (Amp 1). (B) CTCF motif present in Amp 1. (C) Quantification (ChIP-qPCR) of CTCF binding at Amp 1 in healthy T cells activated and expanded (basal) versus T cells expanded in the presence of TNF-α, n = 3. (D) CTCF binding to Amp 1 in activated T cells for HDs and patients with AID, n = 4. Relative CTCF enrichment was normalized against basal in C or HDs in D. Results are expressed as mean + SEM. *P < 0.05, paired two-tailed t test.

