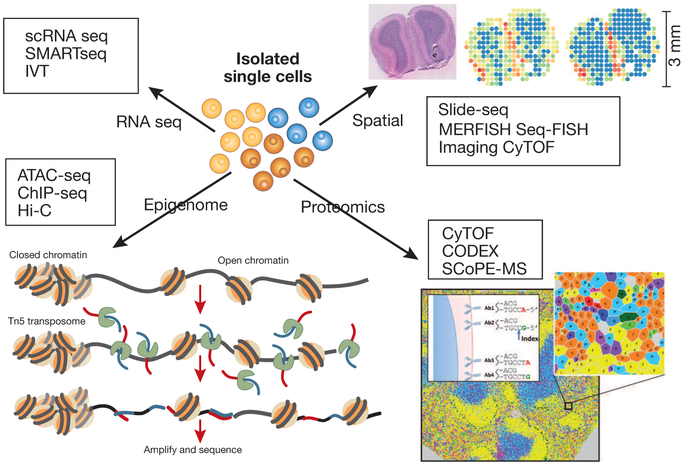
Figure 2: Single cells omics analysis Various methods exist to analyze single cell data to provide transcriptomic, epigenomic, spatial, and proteomic information.
Borrowed/Adapted from Goltsev Y, Samusik N, Kennedy-Darling J et al. Deep Profiling of Mouse Splenic Architecture with CODEX Multiplexed Imaging Cell vol 174, Issue 4, Pages 968-981.e15; https://doi.org/10.1016/j.cell.2018.07.010
[29] and Borrowed/Adapted from Ståhl P, Salmén F, Vickovic S et al Visualization and analysis of gene expression in tissue sections by spatial transcriptomics Science 01 Jul 2016: Vol. 353, Issue 6294, pp. 78-82 DOI: 10.1126/science.aaf2403
[59] with permission from AAAS .

