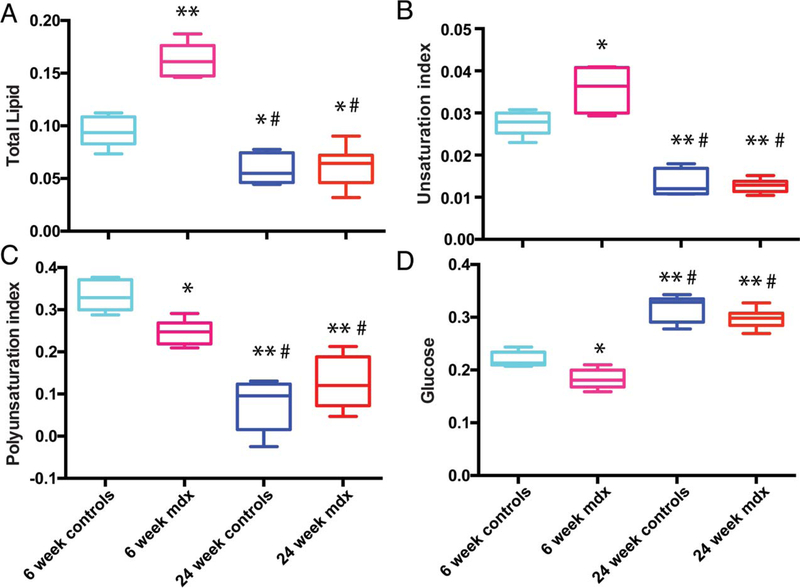
FIGURE 4.
Quantification of serum metabolites. Relative abundance quantification from the 1H spectra of lipids and glucose in the serum of control and mdx mice at both 6 and 24 weeks of age. Significance was determined by P = 0.05. Comparisons with 6-week controls with P < 0.01 are denoted with *. Comparisons with 6-week controls with P < 0.001 are denoted with **. Comparisons with 6-week mdx with P < 0.001 are denoted with #. Comparisons with 24-week controls with P < 0.01 are denoted with †

