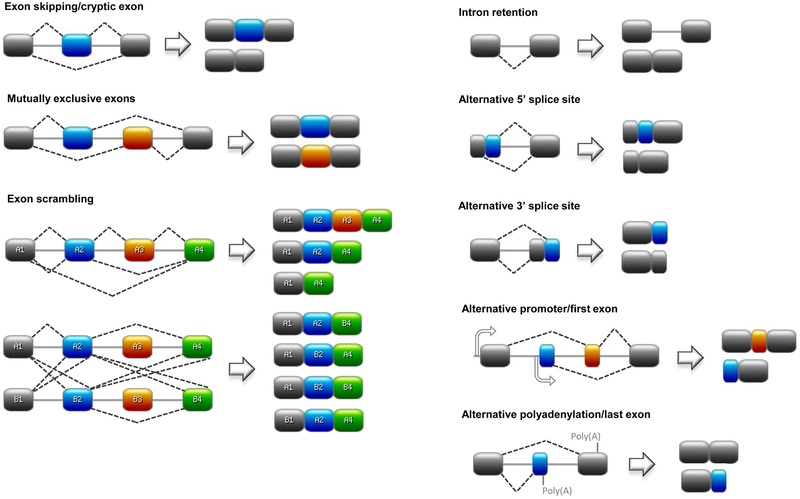
Fig. 1. Schematic representations of different types of splicing events.

Exons are depicted as rectangles and introns as solid lines. Broken lines represent splicing events. Abbreviations: Poly(A), polyadenylation site. Designed on https://prosite.expasy.org.
