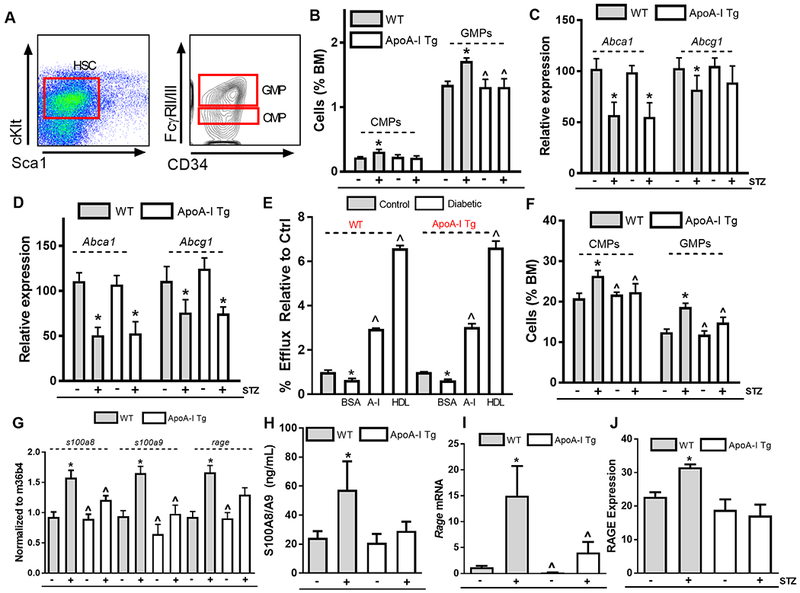
Figure 3. Raising apoA-I/HDL in diabetic mice suppresses hyperglycemia-driven myeloproliferation by promoting cholesterol efflux and suppressing neutrophil S100A8/A9 production.

(A) Representative flow cytometry of monocyte and neutrophil precursors, common myeloid progenitors (CMPs), and granulocyte macrophage progenitors (GMPs). (B) Quantification of CMPs and GMPs in the bone marrow in WT, diabetic WT, apoA-I Tg, and diabetic apoA-I Tg mice (n=7–9/grp). Abca1 and Abcg1 expression in (C) CMP and (D) GMP populations within the bone marrow (n=7–9/grp). (E) Cholesterol efflux capacity of monocyte progenitors (CMPs & GMPs) for WT, diabetic WT, apoA-I Tg and diabetic apoA-I Tg mice (n=9 mice/grp). (F) CMP and GMP cell cycle analyses in the bone marrow in WT, diabetic WT, apoA-I Tg, and diabetic apoA-I Tg mice (n=7–9/grp). (G) s1008, s100a9 and rage expression in neutrophils isolated from WT, diabetic WT, apoA-I Tg, and diabetic apoA-I Tg mice (n=6/grp). (H) Circulating S100A8/A9 plasma protein levels, (I) bone marrow rage expression, (J) CMP RAGE surface expression (n=7–9/grp). Data are expressed as mean ± SEM. * p<0.01 compared to WT control group or ^ p<0.01 compared to WT STZ group as determined via 2-way ANOVA and Tukey’s post-hoc test in panel (B)-(D), (F)-(J). * p<0.05 compared to the control group or ^ p<0.05 compared to the diabetic BSA group for WT and ApoA-I Tg mice respectively as determined via 1-way ANOVA and Tukey’s post-hoc test in panel (E).
