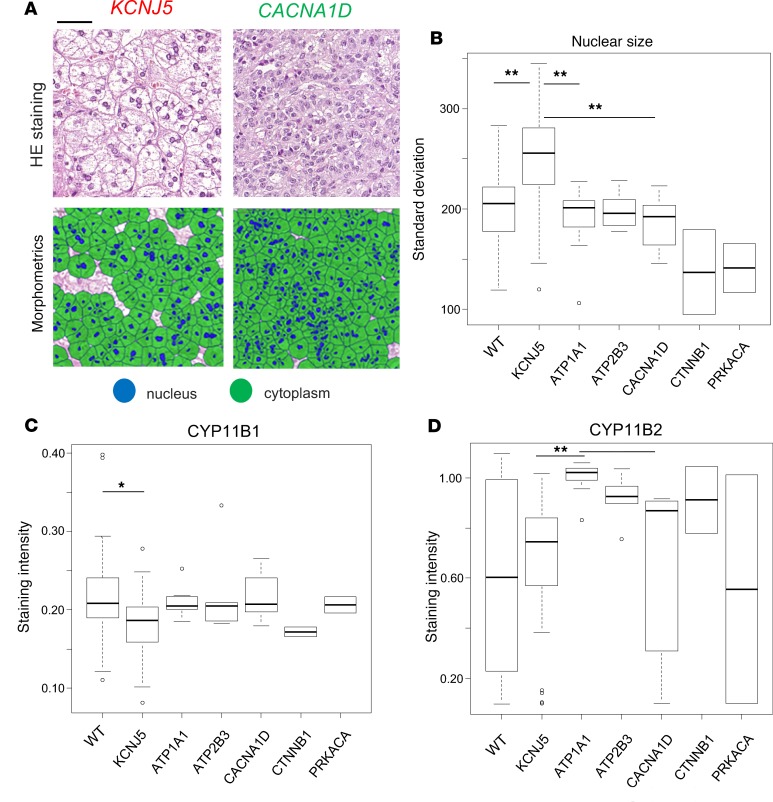
Figure 1. Comparison of morphometric features and genotypes of 132 APA samples.
Representative images of H&E staining and morphometric analysis (A) (scale bar: 50 μm), with standard deviation of nuclear size with respect to genotypes, indicating nuclear variability in KCNJ5-mutated samples (adjusted P < 0.001) (B). Quantification of staining intensities for steroidogenic enzymes correlated with mutation status, demonstrating lower CYP11B1 expression in KCNJ5-mutated tumors (C) and higher CYP11B2 expression in ATP1A1-mutated tumors (D). Median intensity of 3 cores from each patient was used for IHC profiles of steroidogenic enzymes. Kruskal-Wallis test was used for statistical analysis. *P < 0.05; **P < 0.01. The box plots depict the minimum and maximum values (whiskers), the upper and lower quartiles, and the median. The length of the box represents the interquartile range.

