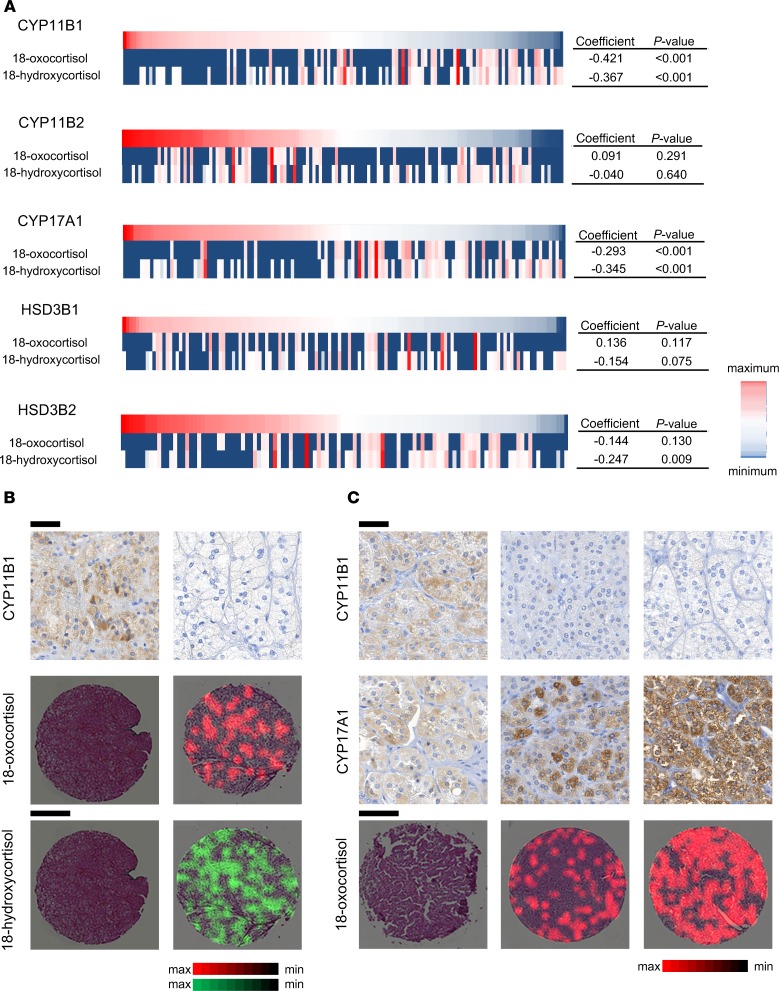
Figure 3. Correlations between IHC of steroidogenic enzymes and metabolic profiles of 18-hydroxycortisol and 18-oxocortisol.
(A) Heatmap visualizations of relationships between IHC and 18-oxocortisol and 18-hydroxycortisol in 49 KCNJ5-mutated APAs with results of Spearman’s rank correlation coefficient. (B) Representative images of 18-oxocortisol (red) and 18-hydroxycortisol (green) expression from cores with high and low staining intensity of CYP11B1. (C) Comparison of immunohistochemistry of CYP11B1 and CYP17A1 and 18-oxocortisol expression (red) in cores with lower-than-median expression of CYP17A1. Scale bars: 500 (metabolites), 50 μm (IHC).

