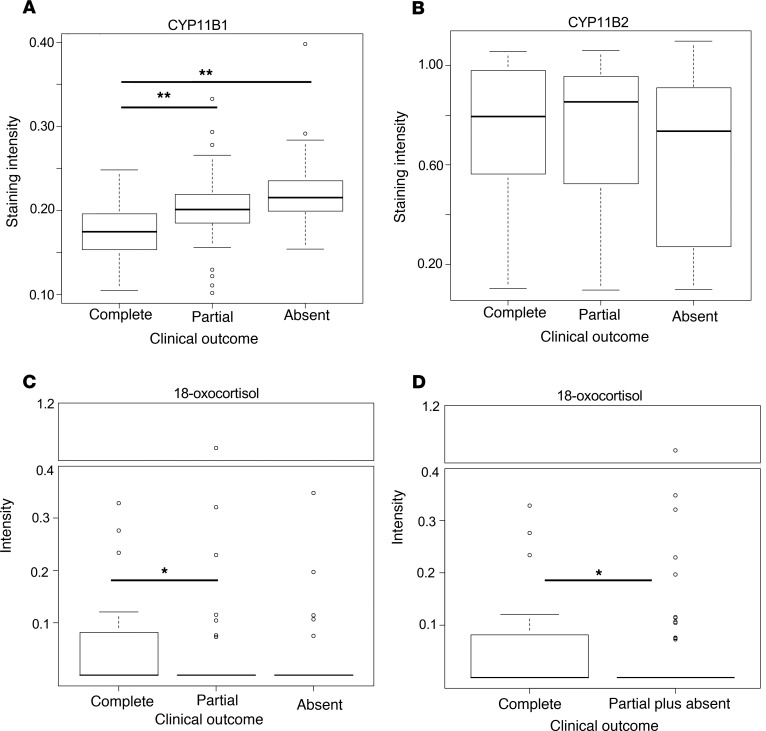
Figure 4. IHC and metabolic profiles on clinical outcome of 136 patients with APA.
Staining intensities of steroidogenic enzymes with regard to clinical outcome: CYP11B1 (P < 0.001) (A) and CYP11B2 (P = 0.449) (B). Intensities of 18-oxocortisol in relation to clinical outcome: comparison among complete, partial, and absent success in clinical outcome (P = 0.041) (C) and that between complete and partial plus absent success in clinical outcome (P = 0.015) (D). Intensities of 3 cores from each patient were classified into highest, median, and lowest intensity. Median intensity of 3 cores from each patient was used for analysis. Mann-Whitney U test and Kruskal-Wallis test were used for statistical analysis. *P < 0.05; **P < 0.01. The box plots depict the minimum and maximum values (whiskers), the upper and lower quartiles, and the median. The length of the box represents the interquartile range.

