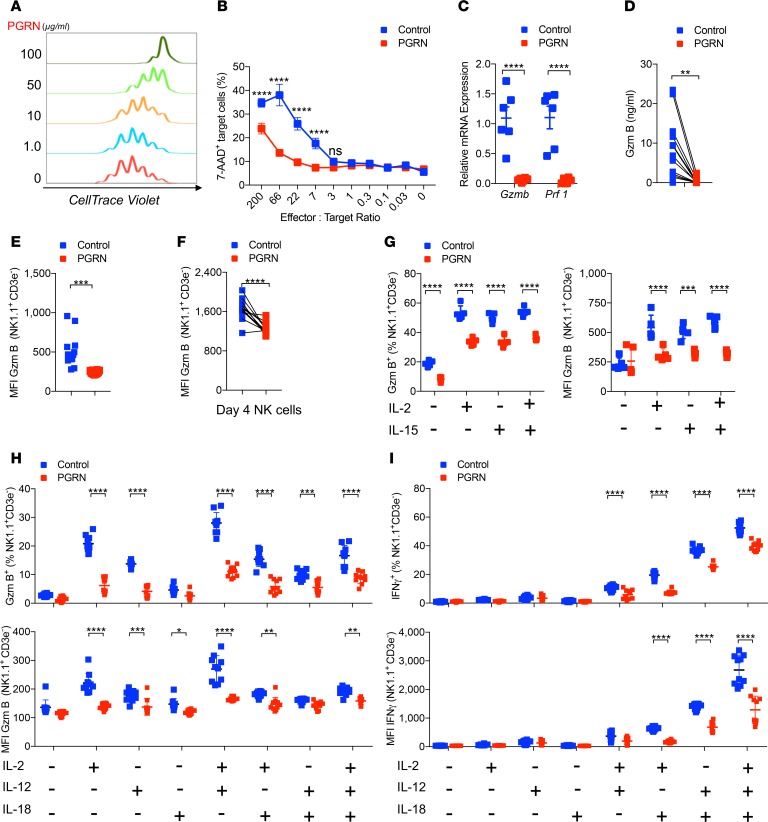
Figure 1. Progranulin limits NK cell–mediated cytotoxicity.
(A) Isolated NK cells were cultured with 1000 IU/ml IL-2 and indicated doses of progranulin (PGRN) for 4 days. The division of these NK cells were determined by flow cytometry (n = 3). (B) The cytotoxic activity of PGRN (100 μg/ml) treated NK cells to RMA/S cell was measured at indicated effector/target ratios (n = 4–5). (C) Granzyme B (Gzmb) and perforin (Prf1) mRNA levels from PGRN-treated (100 μg/ml) NK cells and controls were determined by qPCR (n = 6). (D) Granzyme B protein concentrations were measured in the supernatants (n = 12). (E) Mean fluorescence intensity (MFI) of granzyme B was determined in NK cells in presence of RMA/S cells with or without PGRN treatment (n = 16). (F) The expanded NK cells were treated with PGRN overnight. Gzm B MFI in NK cell was measured by flow cytometry (n = 12). (G) Splenocytes from naive WT mice were incubated with 1000 IU/ml IL-2 and/or 100 IU/ml IL-15 with or without PGRN (25 μg/ml) for 16 hours. Gzm B expression was measured by flow cytometry. The left panel represents the Gzm B+ NK cell frequency, and the right panel represents the MFI of Gzm B (n = 5). (H and I) Splenocytes from naive WT mice were incubated with 1000 U/ml IL-2, 20 ng/ml IL-12, and 5 ng/ml IL-18 with or without PGRN (25 μg/ml) for 6 hours. Gzm B (H, n = 10) and IFN-γ (I, n = 10) was determined in NK cells by flow cytometry. The upper panels represent the frequency, whereas the lower panels indicate the MFI. Data in B–I show mean ± SEM. P values calculated by 2-way ANOVA (B, C, and G–I); D, E, and F by Student’s t test; *P < 0.05; **P < 0.01; ***P < 0.001; ****P < 0.0001.

