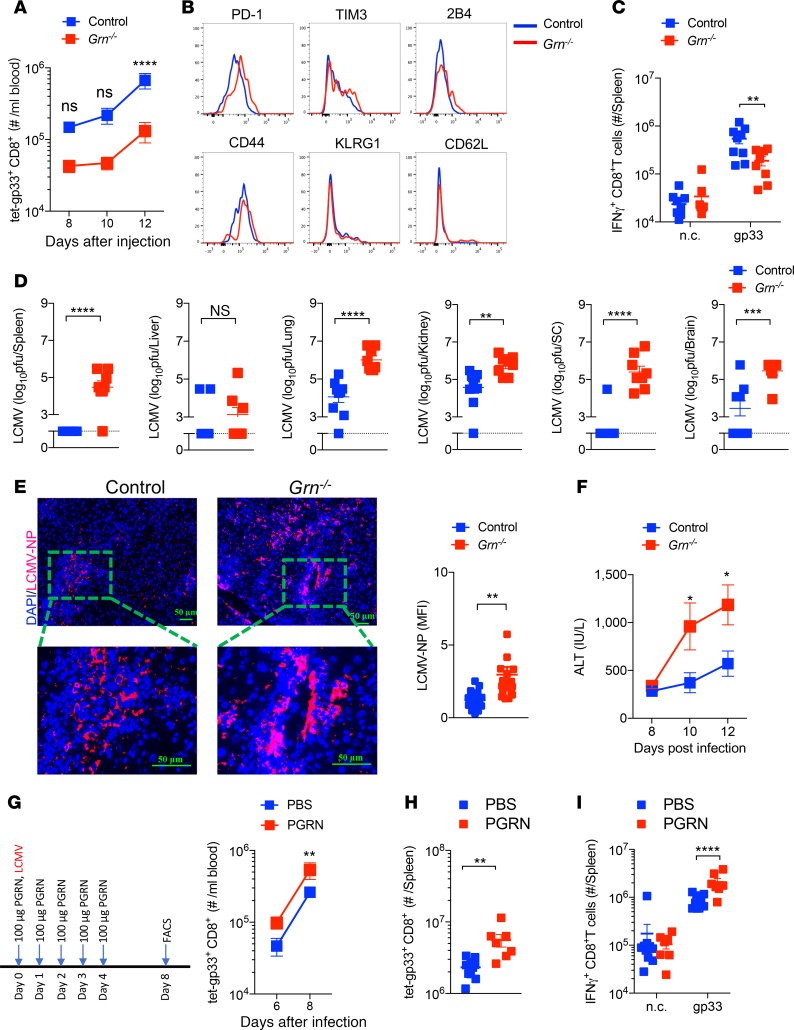
Figure 5. Grn deficiency limits CD8+ T cell immunity and triggers LCMV-induced immunopathology.
WT and Grn–/– mice were infected with 2 × 10⁶ pfu LCMV-WE. (A) Absolute numbers of antiviral CD8+ T cells in the blood were determined at the indicated time points after infection (n = 7–10). (B) The expression of surface molecules on spleen antiviral CD8+ T cells was examined by flow cytometry. (C) At day 12 after infection, splenocytes were restimulated with the LCMV-specific epitope gp33, followed by staining for IFN-γ (n = 7–10). n.c. indicates negative control. (D) Virus titers were determined from spleen, liver, lung, kidney, spinal cord (SC), and brain tissues at day 12 after infection (n = 7–10). (E) Sections of snap-frozen liver tissue from WT and Grn–/– mice (day 12 after infection) were analyzed for LCMV nucleoprotein (LCMV-NP) expression by IHC. The bar graph depicts the fluorescence intensity of LCMV-NP (n = 6). Scale bars: 50 μm. (F) ALT activity in the serum of control and Grn–/– mice was determined at the indicated time points after infection (n = 6). (G–I) WT mice were injected with PGRN at the indicated dose and time points (G, left panel); the absolute number of antiviral T cells in blood (G, right panel) were measured by flow cytometry (n = 7–10). (H) The absolute number of antiviral T cells in the spleen were measured by flow cytometry at day 8 (n = 7–10). (I) Splenocytes were restimulated with gp33 peptides and IFN-γ+CD8+ T cells were measured by flow cytometry (n = 7–10). Data show mean ± SEM. Each symbol represents an individual mouse. P values calculated by 2-way ANOVA (A, C, F, G, I) and Student’s t test (D, E, and H), *P < 0.05; **P < 0.001; ***P < 0.001; ****P < 0.0001.

