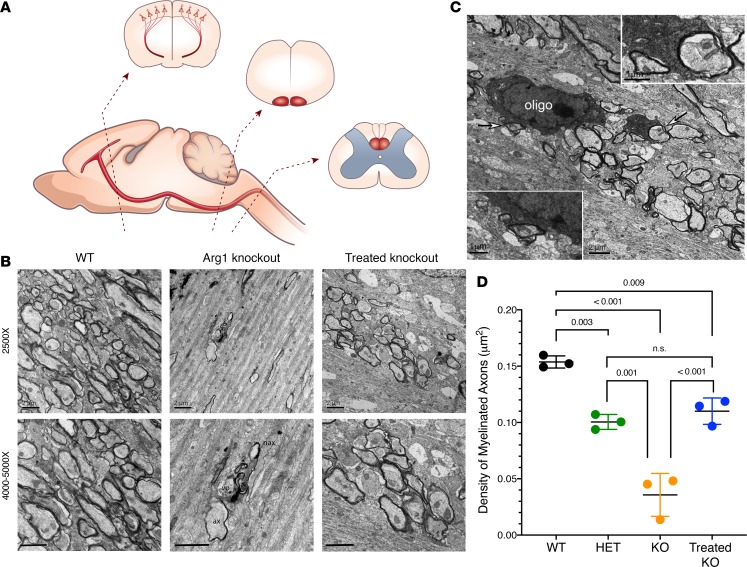
Figure 4. Analysis demonstrates distribution of myelinated axon fibers in the subcortical white matter of the motor cortex of P15 Arg1-deficient mice to be greatly reduced with Arg1 deficiency and restored with hepatic gene therapy.
(A) Diagram with corticospinal tract illustrated. Representative regions that were examined are displayed: motor cortex with layer V pyramidal neurons and their descending axons; medulla, pyramidal tract; cervical segment of spinal cord, corticospinal tract in dorsal funiculus. (B) Assessment of myelination in subcortical white matter of the motor cortex. WT (top) image shows many differently sized myelinated axons; myelin sheath thickness is variable among fibers. WT (bottom) shows higher-magnification image (4,000×). Arg1-KO (top) Image shows only a few axon profiles. Note in the middle is a degenerated axon; another axon with a thin myelin sheath layer is adjacent. Arg1-KO (bottom) shows higher-power view with some fragments of myelin sheath debris; a vacuolar structure (vo) is associated with a degenerated axon indicating debris engulfment (5,000×). One thin myelinated axon (ax) and unmyelinated axon (nax) are closely associated with the degenerated axon. Treated Arg1-KO (top) image shows a significant number of myelinated axons. Treated Arg1-KO (bottom) shows high-power (5,000×) normal axonal features and myelin sheath layers. Scale bars: 2 μm. (C) Micrograph showing electron-dense oligodendrocyte soma (oligo) and a major process wrapping axon fibers (arrows); insets demonstrate the processes tightly enclosing axons. Scale bar: 2 μm and 1 μm [insets]) (D) Density comparison of myelinated axons in subcortical white matter of the Arg1 genotypes. WT has the highest density; untreated KO has the lowest. Treated KO shows remarkable recovery and has the second highest density. Het group shows lower density compared with the WT and treated KO group. P values determined by one-way ANOVA with Tukey’s multiple comparisons. Error bars represent SD. (KO = knockout, Het = heterozygote) (n = 3 per genotype group)

