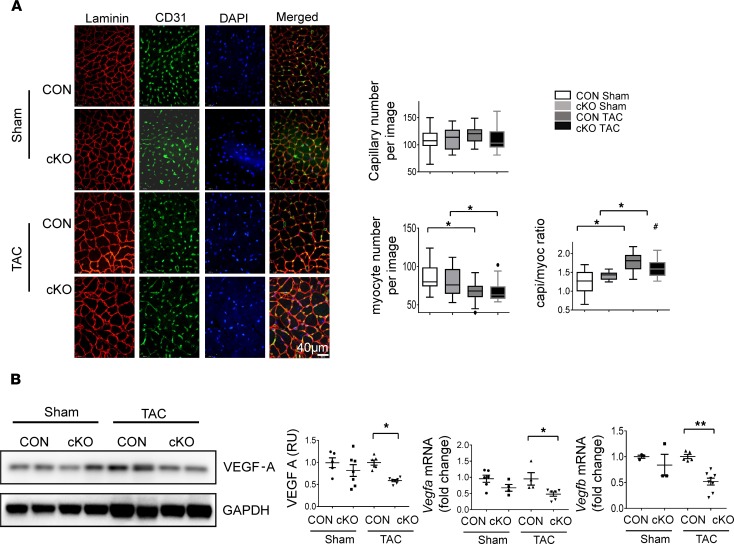
Figure 6. Effects of cardiomyocyte DDT deletion on cardiac angiogenesis and VEGF-A expression after pressure overload.
(A) Immunofluorescence images stained for laminin (red), CD31 (green), and DAPI (blue) in LV sections of CON and cKO mice 7 weeks after sham or TAC surgery. Images were taken with confocal microscopy under original magnification ×30. Right shows quantification of capillary and myocyte density and capillary-to-myocyte ratios. Data are shown as mean ± SEM; n = 5–8 mice per group. (B) VEGF expression in CON and DDT-cKO mice 1 week after sham or TAC. Immunoblots show VEGF-A protein expression with quantification. Right shows Vegfa and Vegfb mRNA expression (quantitative PCR) in LV tissue homogenates. Significance determined by 1-way ANOVA with Tukey’s multiple-comparisons test. *P < 0.05; **P < 0.01, indicated by brackets; #P < 0.05 using 2-tailed Student’s t test to compare the differences between the sham and TAC in the cKO and CON groups.

