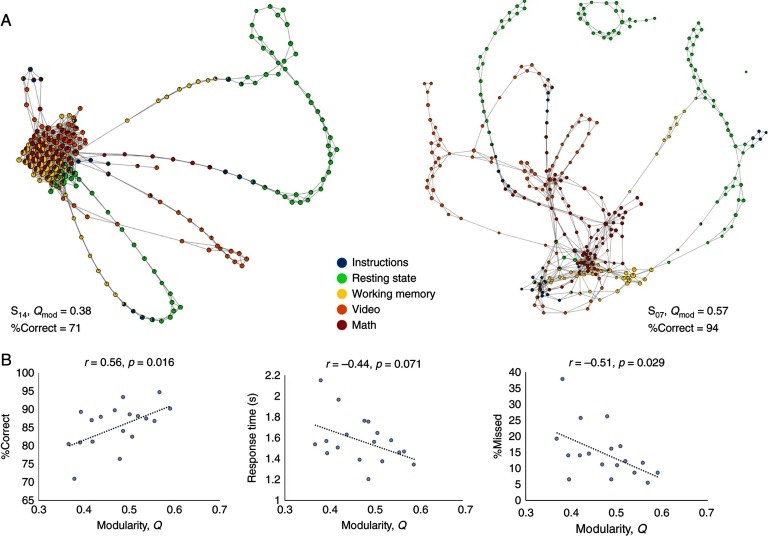
Figure 3. .
Excerpt from Saggar et al. (2018) showing the comparison of shape graphs constructed using topological data analysis of the evolution of brain activations measured with fMRI. (A) Graphs for two subjects are shown and were quantified based on modularity (Qmod) and showed a wide difference in performance (%Correct), with S14 (left) showing low modularity and S07 (right) showing higher modularity. (B) The correlation between modularity indices across all subjects and different aspect of behavior. The pattern suggests subjects with higher modularity, which may suggest a more complex manifold architecture, have better behavior.

