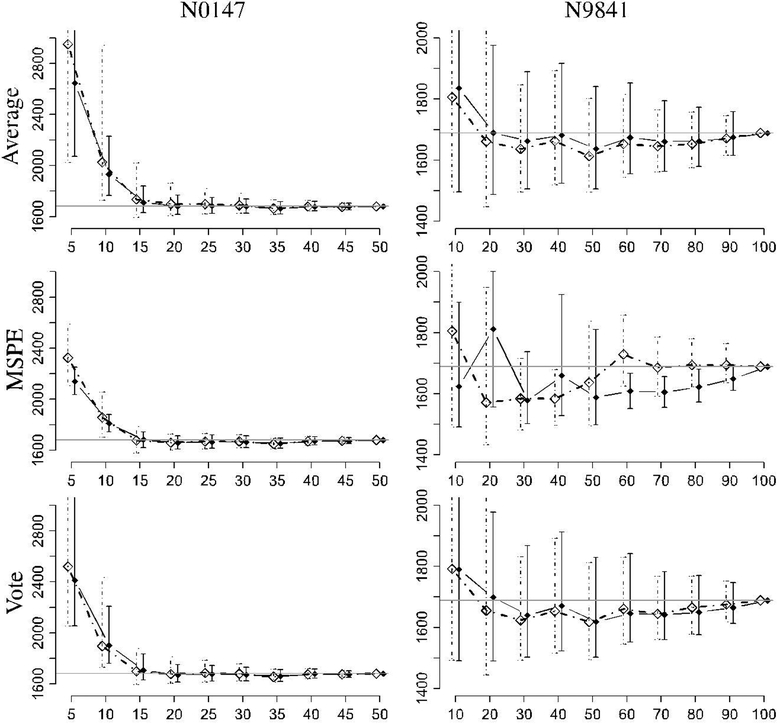
FIGURE 4.
Predicted milestone vs percentage of observed events for the N0147 and N9841 studies. Bayesian results use an open diamond and dotted lines, and the frequentist results are solid. The target is indicated by the horizontal gray line. The targets are 1681 and 1689 days for N0147 and N9841, respectively. MSPE, minimum squared prediction error

