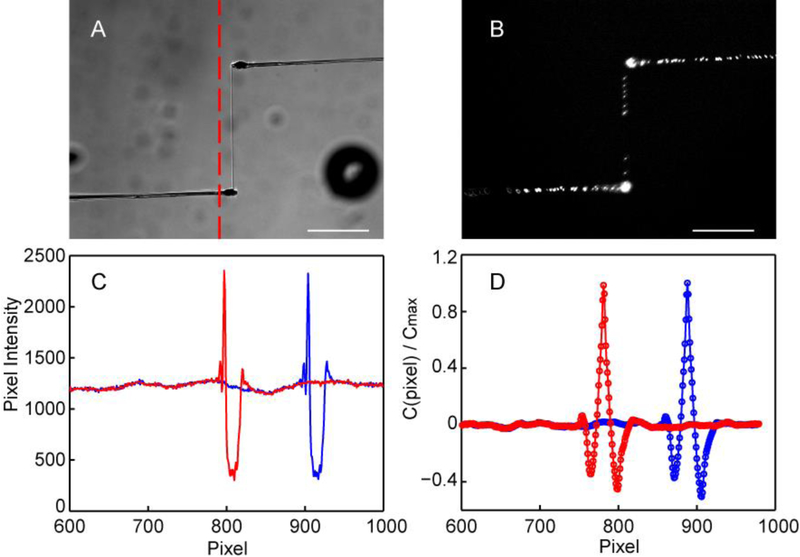
Figure 2.
Pipette tracking method. A) The fixed sensor pipette (bottom-left), Fn fiber, and puller pipette (top-right) are imaged in a brightfield microscope at each time point. A linescan (dashed red line) crossing the end of sensor pipette is processed to track its displacement. B) The Fn fiber contains sparsely distributed fluorescent beads as fiducial markers. C) Representative linescans for the region shown with a vertical dashed red line show the sensor pipette profile when relaxed (blue) or under tension (red). D) The sensor pipette is tracked by comparing the displacement of the pipette signature between the relaxed position (blue) and current position (red) using a cross correlation function C(n) defined in Eq. (1). Sub-pixel resolution was obtained by fitting a quadratic function to the peak of the cross-correlation function. Scale bars are 50 μm, and the length/pixel ratio is 0.64 μm/pixel.

