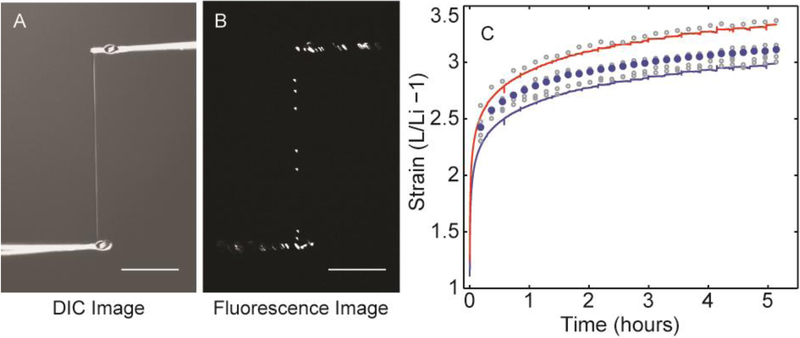
Figure 4.
Fn fiber strain was validated by tracking the positions of fluorescent microbeads embedded within the Fn fiber. These beads acted as fiducial marks along the length of the fiber allowing the fiber strain to be tracked optically independent of the pipette locations. The strain of individual fiber segments calculated by measuring the distance between different pairs of beads is shown as open circles. The total fiber strain determined by the positions of the first and last bead is shown as filled blue circles. These data are compared to the fiber strain determined by pipette displacement and motor position. The fiber initial length in this case was determined by initial pipette-center to pipette-center distance (blue line) or initial pipette-inside-edge to pipette-inside-edge distance (red line). This fiber was stretched with a constant force load of 175 nN.

