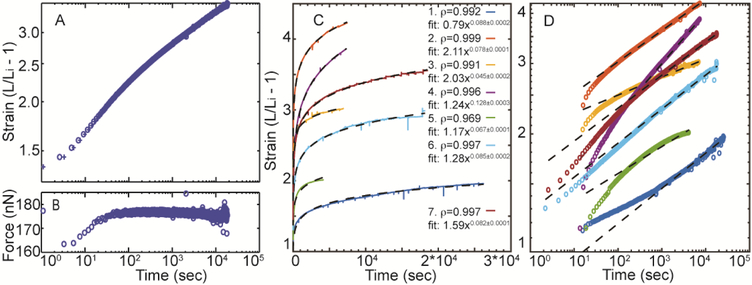
Figure 6.
The strain of a typical Fn fiber under 5 hours of constant force extension plotted in log-log axes (A). The uncertainty in the data acquisition time is shown by bounding the time before (marked as ‘ ’) and after (marked as ‘✚’) the fiber displacement measurement. Note that these boundaries are almost overlapping and not visible after ~100 seconds. Time was set to zero at the first data point collected after the fiber was given a fast force ramp. The corresponding fiber tension is shown on log-linear axes (B). Representative strain versus time plots are shown for 7 additional fibers in (C) and (D) on linear and log-log scales. Power law fits for all fibers are provided in the inset of panel (C).

