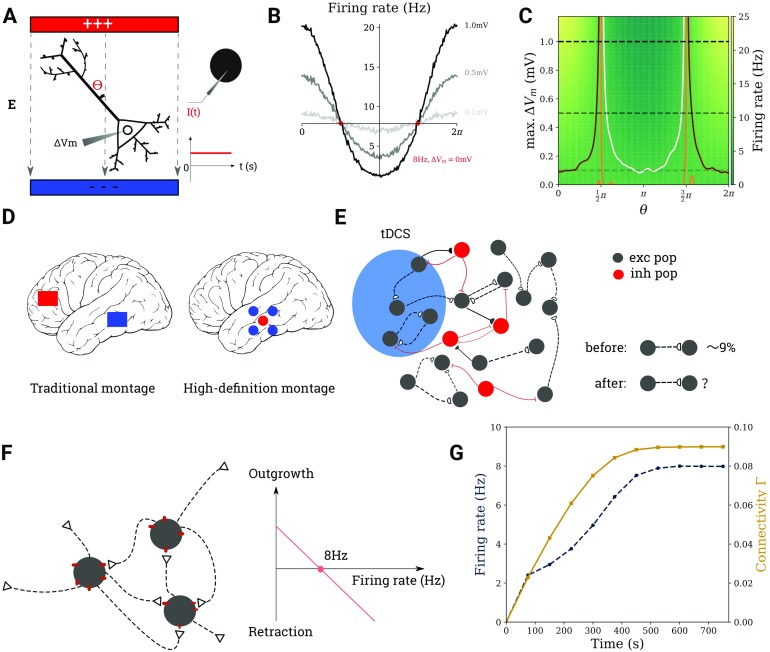
Figure 1. .
Modeling the effect of tDCS on cortical networks. (A) It is assumed that transcranial stimulation leads to a weak polarization of the neuron’s membrane potential (left). For a point neuron, this is achieved by injecting a current of suitable strength into its soma (right). (B) Firing rate modulation with the angle θ for three different values of ΔVm (dotted lines on C). (C) Firing rate of a neuron, the ongoing activity of which is modulated by tDCS, for different values of θ and membrane polarization ΔVm. The contour lines correspond to 7 Hz, 8 Hz, and 9 Hz in white, orange, and maroon. (D) Electrode montages used in tDCS. (E) The region of interest subject to tDCS is modeled as a recurrent network of excitatory and inhibitory neurons. (F) Excitatory-to-excitatory synapses require the combination of a bouton (empty triangle) and a spine (red dot). The growth rate of both types of synaptic elements depends linearly on firing rate. (G) The network is grown from scratch before each tDCS stimulation experiment.

