Figure 3. .
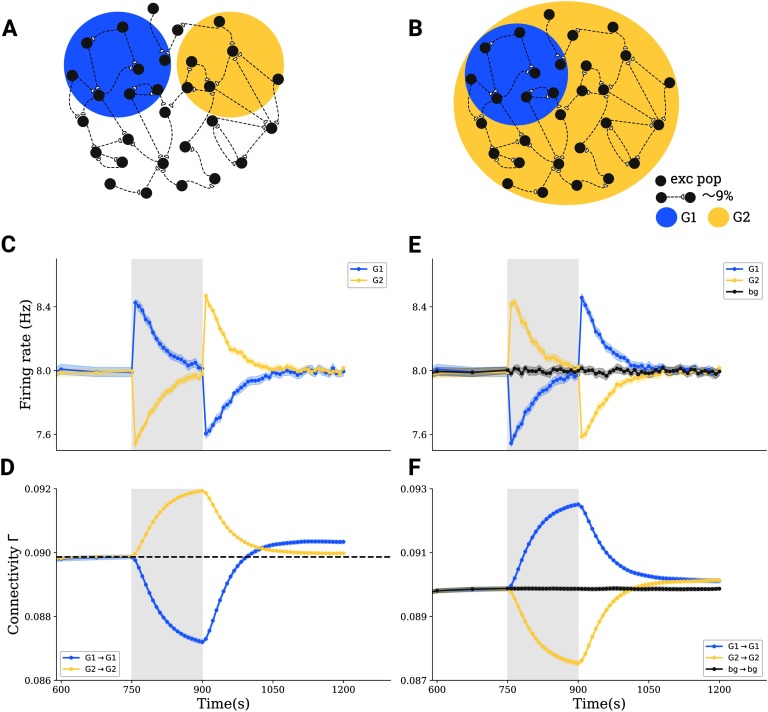
Interactions between subpopulations and cell assembly formation in more complex stimulation paradigms. (A) Tri-group scenario: 30% of all neurons in a network (G1) are depolarized by 0.1 mV, another 30% (G2) are hyperpolarized by − 0.1 mV, and the rest of 40% receives no stimulus. (B) Bi-group scenario: 30% (G1) are hyperpolarized by − 0.1 mV, and the remaining 70% (G2) are depolarized by 0.1 mV. (C,E) Group averages of firing rates in G1 (blue) and in G2 (yellow) before, during, and after stimulation. (D,F) Group averages of the connectivity within G1 (blue), within G2 (yellow), and between G1 and G2 (gray).

