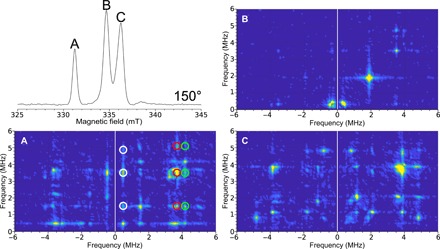
Fig. 6. Single-crystal HYSCORE EPR of the H-cluster in [FeFe]-hydrogenase.

Top left: Field-swept two-pulse ESE EPR spectrum at 150°. The figure labels (A, B, and C) are representative of the spectral peaks. The HYSCORE spectra collected with the 0.4 mm inner diameter self-resonant microhelix of a [FeFe]-hydrogenase single crystal of C. pasteurianum (CpI) in the Hox state at an orientation of 150° collected at a temperature of 15 K. The 2D density representation shows correlations between the nuclear spin transitions in both projections of the electronic spin. (A) Clean HYSCORE spectrum due to the peak corresponding to only one of the EPR signals in the unit cell of the crystal. The correlated features between these transitions are indicated by the white, red, and green circles. (B) Relatively featureless HYSCORE spectrum suggests little hyperfine interaction at this orientation. (C) HYSCORE on two overlapping EPR signals representing different orientations of the enzyme molecule with respect to the magnetic field. The HYSCORE was set up using the Bruker HYSCORE wizard with the following settings: π/2, 40 ns; τ, 280 ns; and Δτ, 48 ns with 256 points each and 20 shots per point. Each HYSCORE spectrum was collected in approximately 1 hour.
