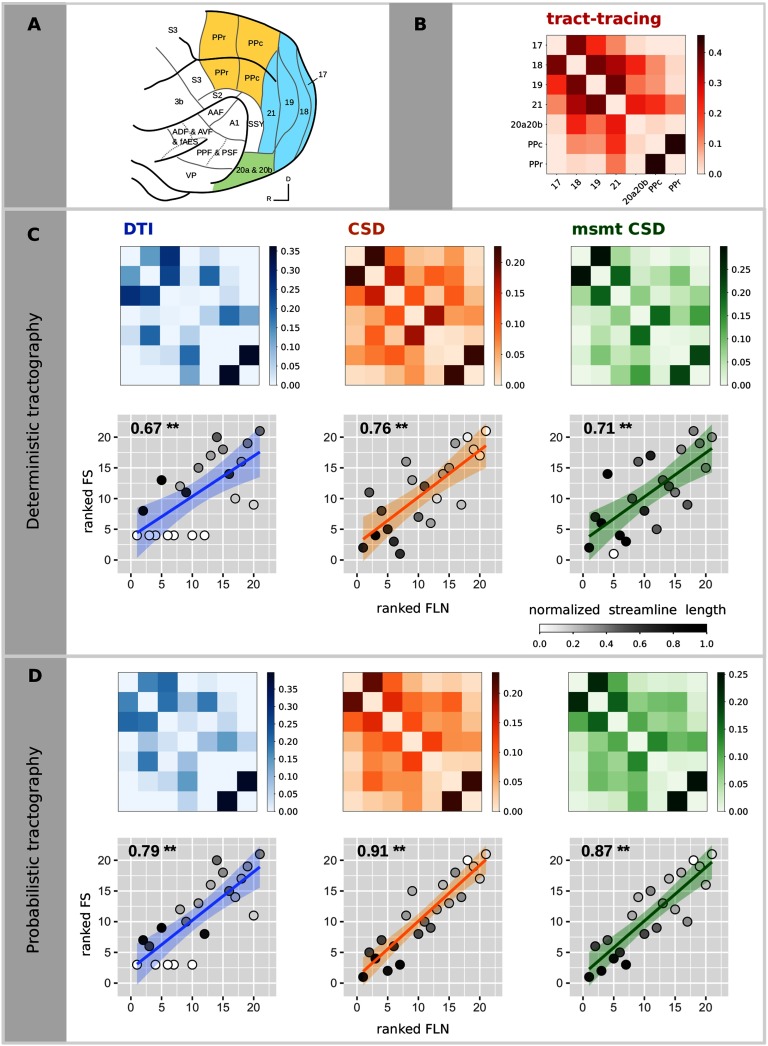
Figure 1. .
Relationship between diffusion MRI tractography and tract-tracing experiments. (A) Ferret brain atlas according to the parcellation of Bizley and King (figure adapted from Bizley & King, 2009). The regions of interest for the comparative study are those colored. Colors code for the different visual brain areas: posterior parietal (yellow), occipital (blue), and temporal cortices (green). (B) Structural connectivity matrix based on tract-tracing experiments, where the weights represent the fraction of labeled neurons (FLN). Structural connectivity matrices estimated from the deterministic (C) and the probabilistic (D) tractography algorithms and the associated scatterplots of the ranked FLN vs. the ranked FS. Each point in the scatterplot corresponds to a connection between a pair of areas for the tract-tracing results (abscissa) and the diffusion results (ordinate). The ranked weights of the connections allow visualization of the Spearman’s rho as the slope of the fitted curve. Gray colors code for the average streamline length (values normalized by the maximum streamline length of all the algorithms). P values smaller than 0.001 are indicated by **.

