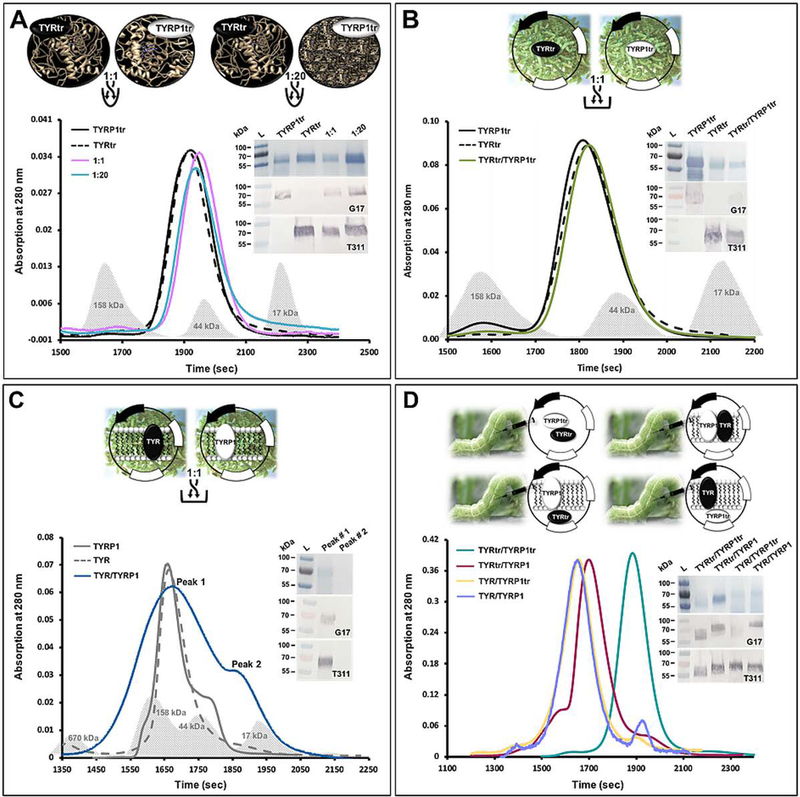
Figure 2. Experimental design for testing potential TYR/TYRP1 hetero-association.
Panel A: Individually purified TYRtr and TYRP1tr and their mixtures at 1:1 and 1:20 ratios.
The graph shows the chromatography profiles of TYRtr (black dashed line), TYRP1tr (black solid lane), and TYRtr/TYRP1tr mixtures at a ratio of 1:1 (purple line) and 1:20 (cyan line). Panel B: Mixture of the intra-melanosomal domains of TYR and TYRP1 purified from the larval biomasses individually expressing both proteins. The graph shows the chromatography profiles of TYRtr (black dashed line), TYRP1tr (black solid lane), and a TYRtr/TYRP1tr biomass mixture at a ratio of 1:1 (green line). Panel C: Mixture of full-length TYR and TYRP1 purified from the larval biomasses individually expressing both proteins. The graph shows the chromatography profiles of TYR (gray dashed line), TYRP1 (gray solid lane), and a TYR/TYRP1 biomass mixture at a ratio of 1:1 (blue line), in which two peaks were observed. Gray shadows in each panel correspond to the Bio-Rad GF standards. Panel D: Four different combinations of proteins prepared by baculovirus injection at a 1:1 ratio, independently coexpressed in Ti. ni larvae, and purified. The graph shows the chromatography profiles of TYRtr/TYRP1tr (green line), TYRtr/TYRP1 (red lane), TYR/TYRP1tr (yellow line), and TYR/TYRP1 (purple line).
The insets in each panel show the SDS-PAGE results (top panel) and Western blots using anti-TYRP1 (G17, middle panel) and anti-TYR antibodies (T311, bottom panel).

