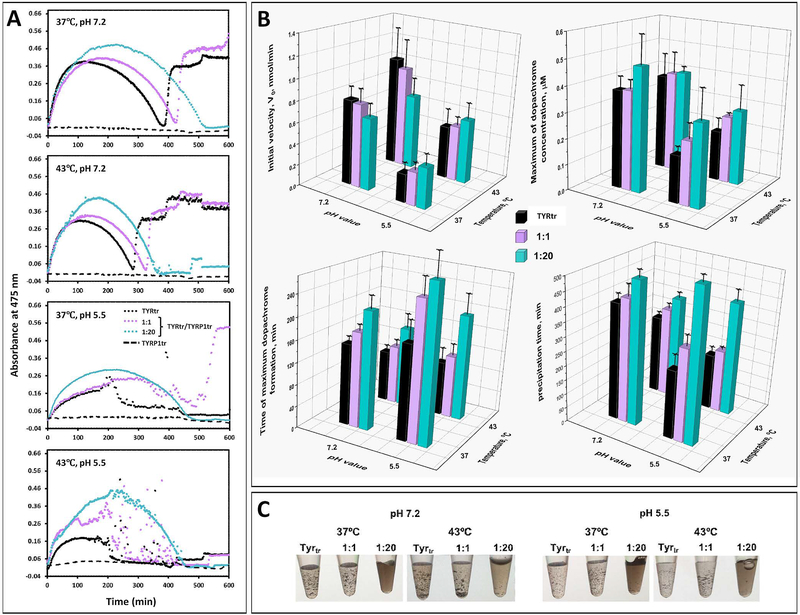
Figure 3. Dopachrome formation by TYRtr under TYRP1tr protection.
Panel A: Representative time curves of the diphenol oxidase activities of TYRtr alone (black dots) and in the presence of TYRP1tr in 1:1 (purple dots) and 1:20 (cyan dots) ratios at pH 7.2 and 5.5 and at temperatures of 37°C and 43°C. Panel B: The initial velocity (V0), the initial linear rate of dopachrome formation, defined as the number of nmoles of dopachrome formed per minute, was calculated from the slope of the progress curve for a reaction (top left). Maximum of dopachrome concentration presented in μM using the Beer-Lambert law, A=εbc, where A is absorbance; ε is the extinction coefficient for dopachrome at 475 nm (3700 M−1 cm−1); b is the path length of the well in which the sample is contained (cm); and c is the concentration of TYRtr in μM (top right). The time when the maximum dopachrome was formed is shown in minutes (bottom left). The melanin-like precipitation time is shown in minutes (bottom right). Values for TYRtr are shown as black bars, TYRtr in the presence of TRP1tr in a 1:1 ratio as purple bars, and TYRtr in the presence of TRP1tr in a 1:20 ratio as cyan bars. Errors represent the standard deviations from 3 independent experiments. Panel C: Pictures show melanin-like precipitation, which appeared during the incubation of L-DOPA with TYRtr and TYRtr/TYRP1tr mixtures in both 1:1 and 1:20 ratios at pH 7.2 and 5.5 and at temperatures of 37 and 43°C.

