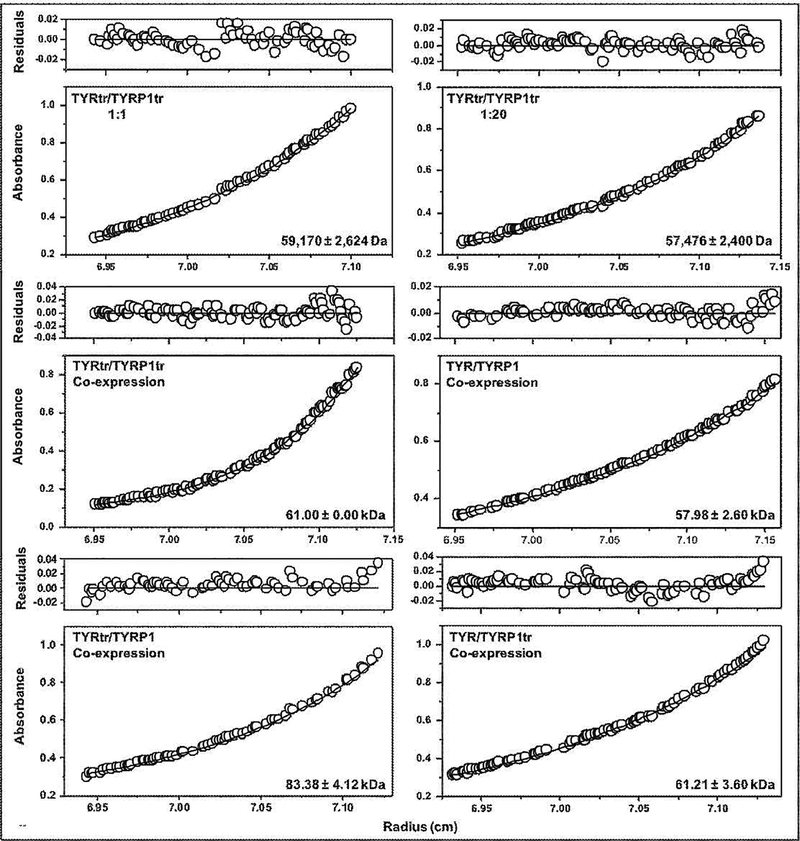
Figure 5.
Sedimentation equilibria of tyrosinases and their mixtures. Protein concentration profiles of absorbance (280 nm) versus radial distance are indicated. The black solid lines show the calculated fit for monomers. Open circles represent experimental values, but the open circles at the top show the residuals between fitted curves and data points.

