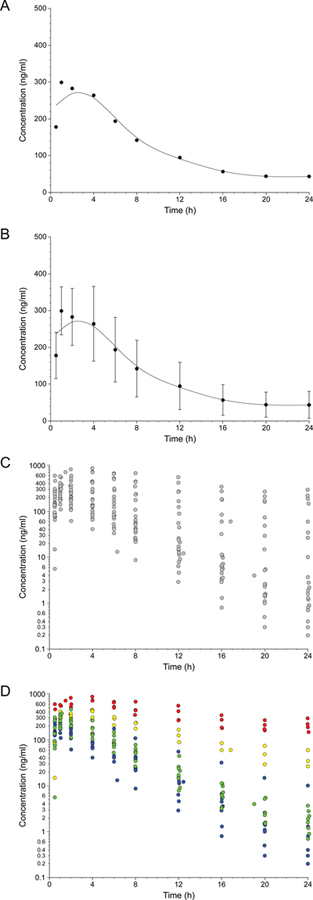
FIGURE 1.
Perceptual framework for the transition from a population perspective of inter-individual variability to one that focuses on individual patients: average plasma concentration-time profile for a group (panel A), representing inter-individual variability as the mean ± one standard deviation of the plasma concentration at each time point (panel B), individual plasma concentration profiles contributing to the population mean (panel C), and identification of factors, such as pharmacogenetic data, that allow the range of possibilities for an individual patient to be reduced (panel D). Raw data used to construct the figure were derived from Brown et al2, and symbol colors in paned D refer to CYP2D6 genotypes corresponding to the following phenotypes: poor metabolizers (no functional alleles; red), intermediate metabolizers (one null allele and one partial function allele; yellow), extensive metabolizers with the equivalent of one functional allele (green), and extensive metabolizers with two functional alleles (blue).

