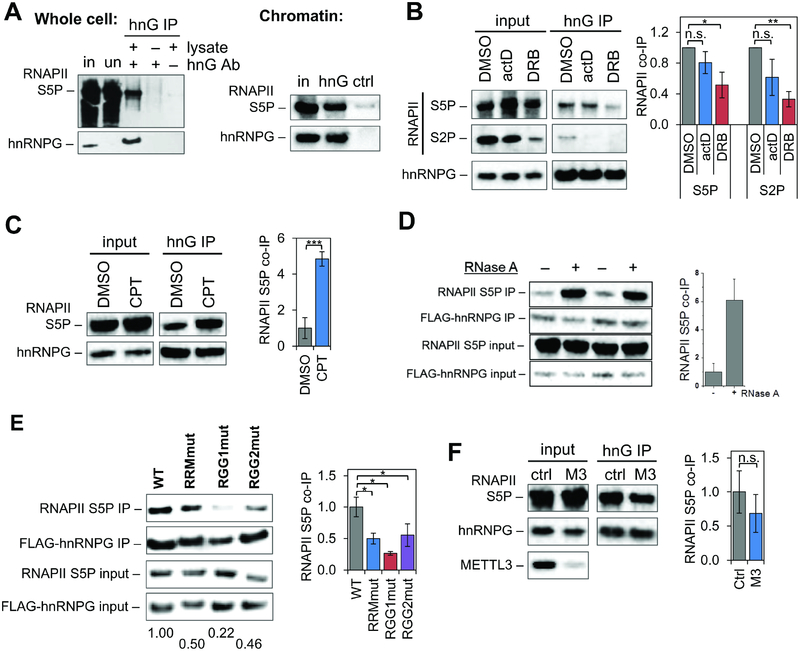
Figure 1: hnRNPG interacts with RNA polymerase II in vivo.
A. Western blot showing co-immunoprecipitation (co-IP) of Ser5-phosphorylated RNAPII (RNAPII S5P) with hnRNPG in whole cell or chromatin extracts. in: input; un: unbound; hnG IP: hnRNPG IP; hnG Ab: hnRNPG antibody; ctrl: isotype control IP.
B. Western blot showing co-IP of RNAPII with hnRNPG in chromatin extracts of cells treated with 0.5% v/v DMSO, 5 μg/mL actinomycin D (actD), or 100 μM DRB for 2 hours. RNAPII co-IP plotted relative to DMSO-treated cells and normalized to hnRNPG IP and to input: (RNAPIIIP / hnRNPGIP) / (RNAPIIinput / hnRNPGinput). Error bars: ± 1 standard deviation; n = 3 biological replicates; n.s., not significant; * p < 0.05, ** p < 0.01 by two-sample t-test.
C. Western blot showing co-IP of RNAPII S5P with hnRNPG in chromatin extracts of cells treated with 0.12% v/v DMSO or 6 μM camptothecin (CPT) for 5 hours. RNAPII co-IP plotted relative to DMSO-treated cells. Error bars: ± 1 standard deviation; n = 3 biological replicates; *** p < 0.001 by two-sample t-test.
D. Western blot showing co-IP of RNAPII S5P with hnRNPG in chromatin extracts treated with RNase A. n = 2 biological replicates. RNAPII S5P co-IP plotted relative to no RNase treatment.
E. Western blot showing co-IP of RNAPII S5P with FLAG–hnRNPG in chromatin extracts of cells transfected hnRNPG siRNA and pCMV3-Flag-RBMX plasmid (WT, RRMmut, RGG1mut, or RGG2mut). RNAPII co-IP measured relative to WT. Error bars: ± 1 standard deviation; n = 3 biological replicates; * p < 0.05 by two-sample t-test.
F. Western blot showing co-IP of RNAPII S5P with hnRNPG in chromatin extracts of cells transfected with control (ctrl) or METTL3 (M3) siRNA. RNAPII co-IP plotted relative to control. Error bars: ± 1 standard deviation; n = 4 biological replicates; n.s., not significant by two-sample t-test.
See also Figure S1.

