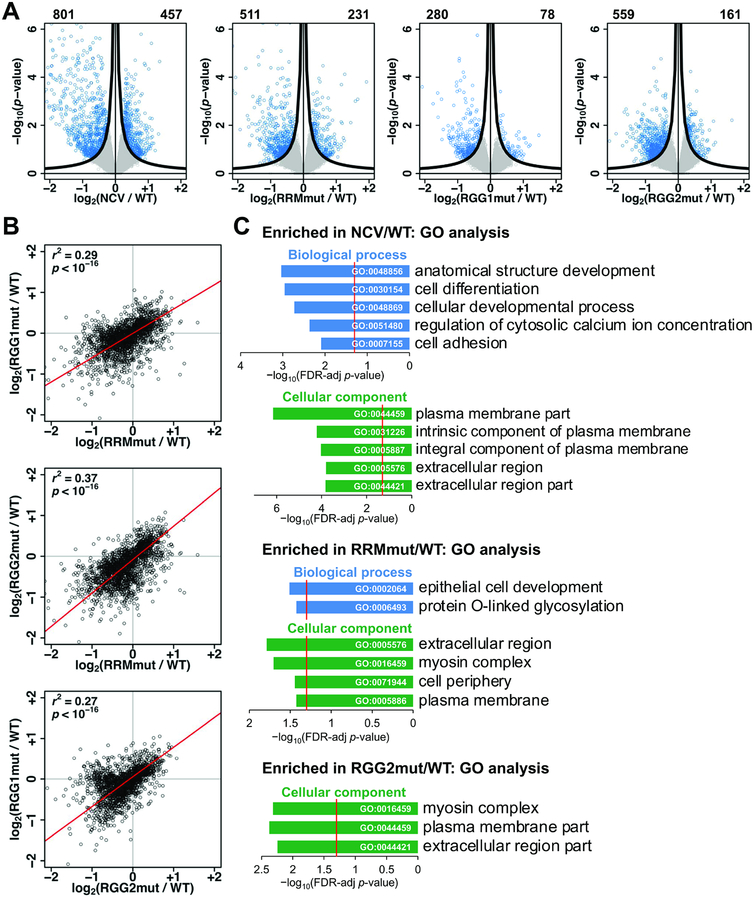
Figure 3: The RRM, RGG1, and RGG2 regions function in regulation of transcript abundance by hnRNPG.
A. Volcano plots showing log2(fold change) and −log10(p-value) for changes in gene expression in NCV, RRMmut, RGG1mut, and RGG2mut relative to WT. Genes satisfying the π value threshold (see methods) were considered differentially expressed. Numbers of down- and up-regulated genes are listed at the top left and right sides, respectively, of each plot. Black curves, π value threshold; blue points, differentially expressed exons; gray points, non-differentially expressed exons.
B. Correlated changes in gene expression, quantified as log2(fold change relative to WT), in mRNA sequencing data for RRMmut, RGG1mut, and RGG2mut. Each point is a gene. r, Pearson correlation coefficient; p, p-value using Fisher transformation; red line, model II major axis linear regression.
C. Gene ontology (GO) analysis showing false discovery rate (FDR) adjusted p-value (−log10) for biological processes (blue) and cellular components (green) enriched among genes differentially expressed relative to WT. Red line: FDR threshold (p = 0.05). Number (n) of genes in each category from top to bottom: NCV/WT biological process (n = 295, 214, 215, 32, 68), cellular component (n = 186, 122, 116, 275, 236); RRMmut/WT biological process (n = 18, 13), cellular component (n = 156, 9, 176, 170); RGG2mut/WT cellular component (n = 10, 97, 130).

