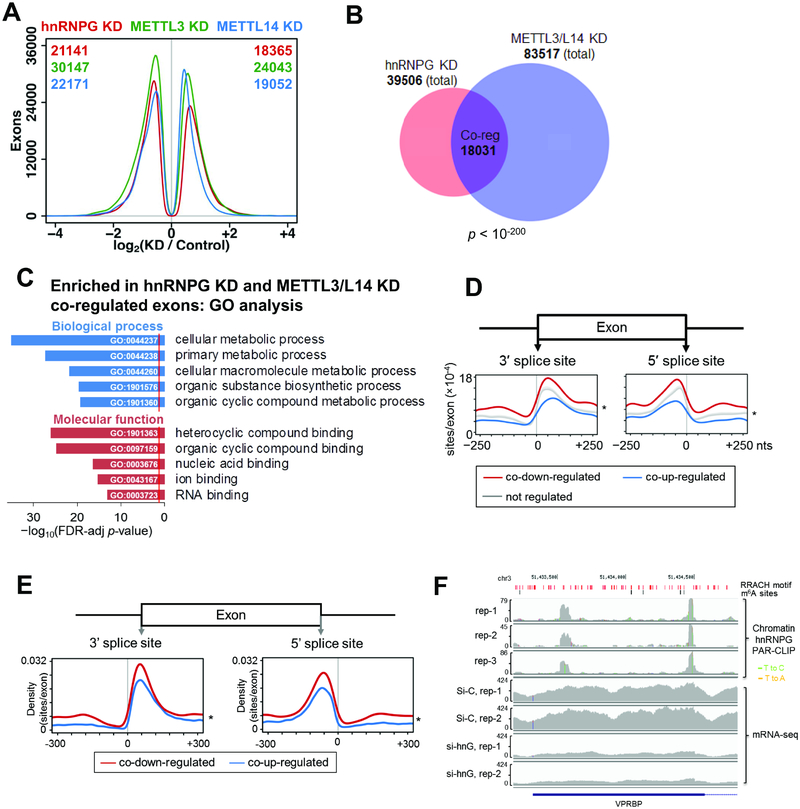
Figure 4: hnRNPG and m6A methyltransferase co-regulate exon splicing.
A. Distribution of differentially expressed exons showing number of exons at each log2(fold change) for hnRNPG (red), METTL3 (green), and METTL14 (blue) knockdown relative to control knockdown (Liu et al., 2017). Numbers of down- and up-regulated differentially expressed exons for each knockdown are listed at the top left and right corners of the plot in the color of the knockdown.
B. Venn diagram showing overlap between exons differentially expressed upon hnRNPG knockdown (39506) and upon METTL3 or METTL14 knockdown (83517). Overlapping exons are co-regulated exons (Co-reg, 18031), with correlated changes in expression upon hnRNPG KD and either METTL3 or METTL14 KD.
C. GO analysis showing false discovery rate (FDR) adjusted p-value (−log10) for biological processes (blue) and molecular functions (red) enriched among genes containing differentially expressed exons that were co-regulated by hnRNPG KD and either METTL3 or METTL14 KD. Red line: FDR threshold (p = 0.05).
D. HnRNPG-bound m6A sites per regulated exon at each site in the −250 to +250 nucleotide region around the splice sites of exons co-down-regulated (11996), co-up-regulated (9818), or not regulated (140932) upon hnRNPG KD and either METTL3 or METTL14 KD. * p < 10−16 by paired t-test between curves for down- vs up-regulated exons.
E. Same as (D) but using hnRNPG binding sites from chromatin associated PAR-CLIP data.
F. Sequencing track of VPRBP gene showing read density by chromatin-associated hnRNPG PAR-CLIP. T-to-C and T-to-A mutations (marks of cross-linking in PAR-CLIP) are shown as green and orange vertical lines. rep: biological replicate; si-C: control siRNA; si-hnG: hnRNPG siRNA. RRACH motifs: red; m6A sites: black.

