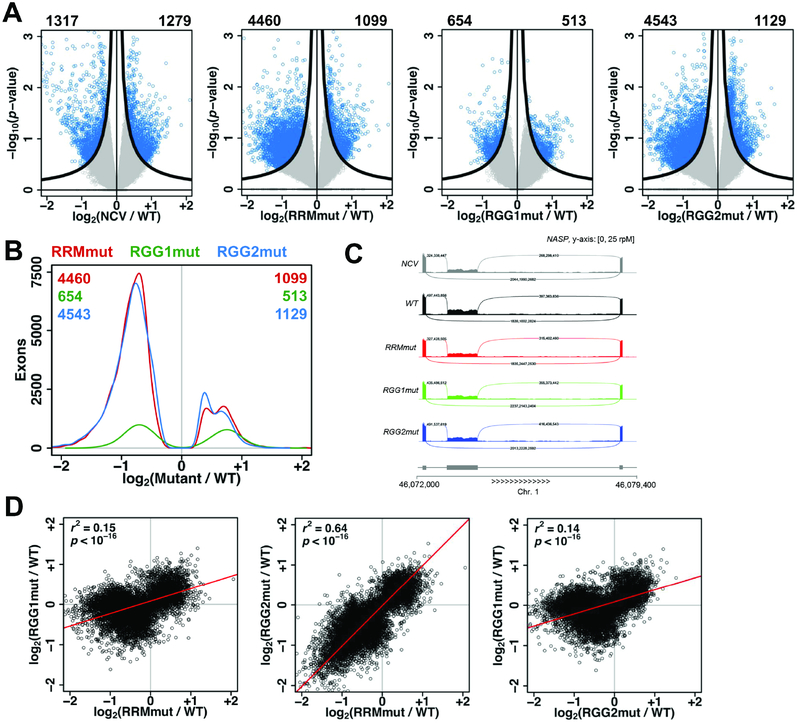
Figure 5: The RRM, RGG1, and RGG2 regions function in regulation of alternative splicing by hnRNPG.
A. Volcano plots showing log2(fold change) and −log10(p-value) for changes in exon expression in NCV, RRMmut, RGG1mut, and RGG2mut relative to WT. Exons satisfying the π value threshold (see methods) were considered differentially expressed. Numbers of down- and up-regulated differentially expressed exons are listed at the top left and right corners of each plot. Black curves, π value threshold; blue points, differentially expressed exons; gray points, non-differentially expressed exons.
B. Distribution of differentially expressed exons showing number of exons at each log2(fold change) for RRMmut (red), RGG1mut (green), and RGG2mut (blue) relative to WT. Numbers of down- and up- regulated differentially expressed exons for each mutant are listed at the top left and top right corners of the plot, in the color of the mutant.
C. mRNA-seq reads for NASP transcripts in NCV (gray), WT (black), RRMmut (red), RGG1mut (green), RGG2mut (blue) expressing cells. Sashimi plot shows down-regulation of the middle exon in NCV, RRMmut, RGG1mut, and RGG2mut compared to WT cells.
D. Correlated changes in exon expression, quantified as log2(fold change relative to WT), in mRNA sequencing data for RRMmut, RGG1mut, and RGG2mut. Each point is an exon. r, Pearson correlation coefficient; p, p-value using Fisher transformation; red line, model II major axis linear regression.
See also Figures S5 and S6, and Table S1.

