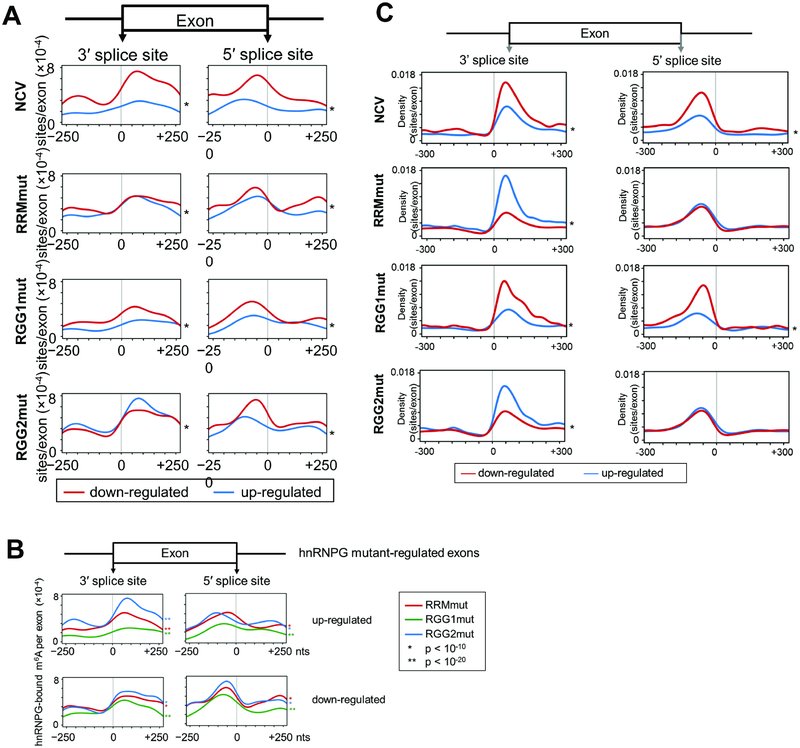
Figure 6: Role of m6A site position in regulation of alternative splicing by hnRNPG.
A. Distribution of hnRNPG-bound m6A sites per regulated exon at each site in the −250 to +250 nucleotide region around the splice sites of exons down-regulated (red) or up-regulated (blue) in NCV (1317 down, 1279 up), RRMmut (4460 down, 1099 up), RGG1mut (654 down, 513 up), and RGG2mut (4543 down, 1129 up) relative to WT. * p < 10−16 by paired t-test between curves for down- vs up-regulated exons.
B. Overlay curves from (A) for RRMmut, RGG1mut, and RGG2mut.
C. Same as (A) but using hnRNPG binding sites from chromatin-associated PAR-CLIP data.
See also Figure S6.

