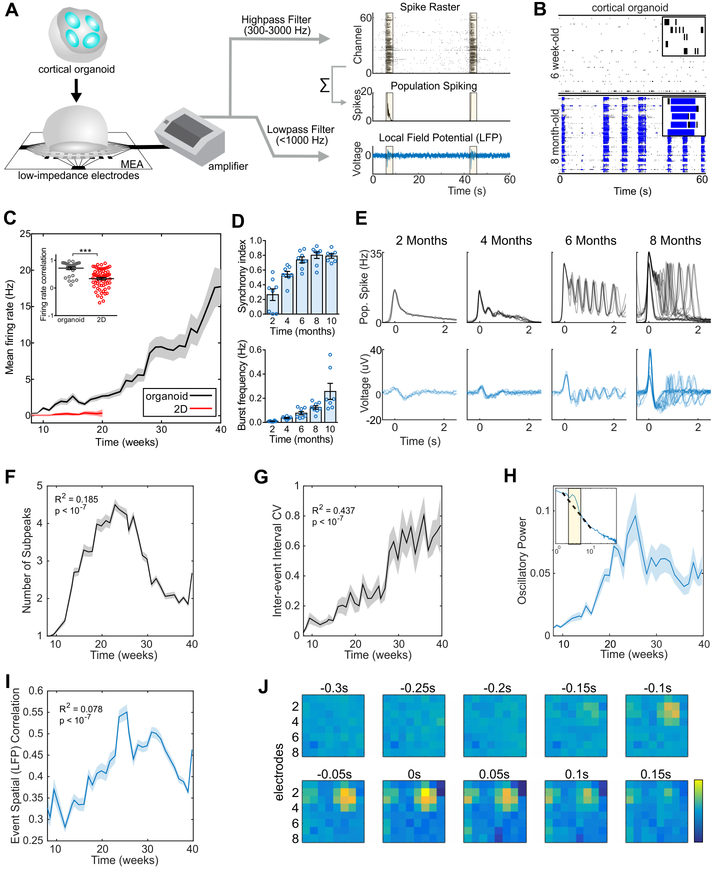
Figure 2. Oscillatory network dynamics in long-term cortical organoids.
(A) Schematic of the organoid signal processing pipeline. Raw MEA data is analyzed as population spiking and LFP separately. Synchronous network events are highlighted in yellow. (B) Raster plot of network spiking activity after 1.5 and 6 months of maturation. A 3-s interval of activity over 5 channels is shown in the upper right corners. (C) Cortical organoids show elevated and continuously increasing mean firing rate compared to 2D monolayer neurons (n = 8 for organoid cultures, and n = 12 for 2D neurons). Inset, correlation of the firing rate vector over 12 weeks of differentiation (from 8 to 20) between pairs of cultures showing reduced variability among organoid replicates. (D) Temporal evolution of cortical organoid network activity. Detailed definitions and further parameters are presented in Figure S2. (E) Time series of population spiking and LFP during network events in cortical organoid development. Each overlaid trace represents a single event during the same recording session. The number of subpeaks during an event (F) is maximized and stereotypical at 6-months, developing nonlinearly and following an inverted-U trajectory. (G) Network variability, measured as the coefficient of variation of the inter-event interval, increases monotonically throughout development. (H) 1-4 Hz oscillatory power in the LFP increases up to the 25th week in culture and plateaus at 30 weeks. Inset, oscillatory power is calculated by fitting a straight line (dashed) over the aperiodic portion of the PSD and taken as the height of narrow peaks rising above the linear fit. (I) Pairwise correlation of LFP across all electrodes (coherence) within a well during network events initially increase, then decreases after 30 weeks. (J) An example of sequential frames during a network event show the spatial propagation of wave spreading, then disappearing again after 100ms. The data shown in C, D, F, G, H, and I are presented as mean ± s.e.m. *P < 0.05, **P < 0.01, ***P < 0.001, unpaired Student’s t-test (C), quadratic (F, H and I) and linear (G) regression.

