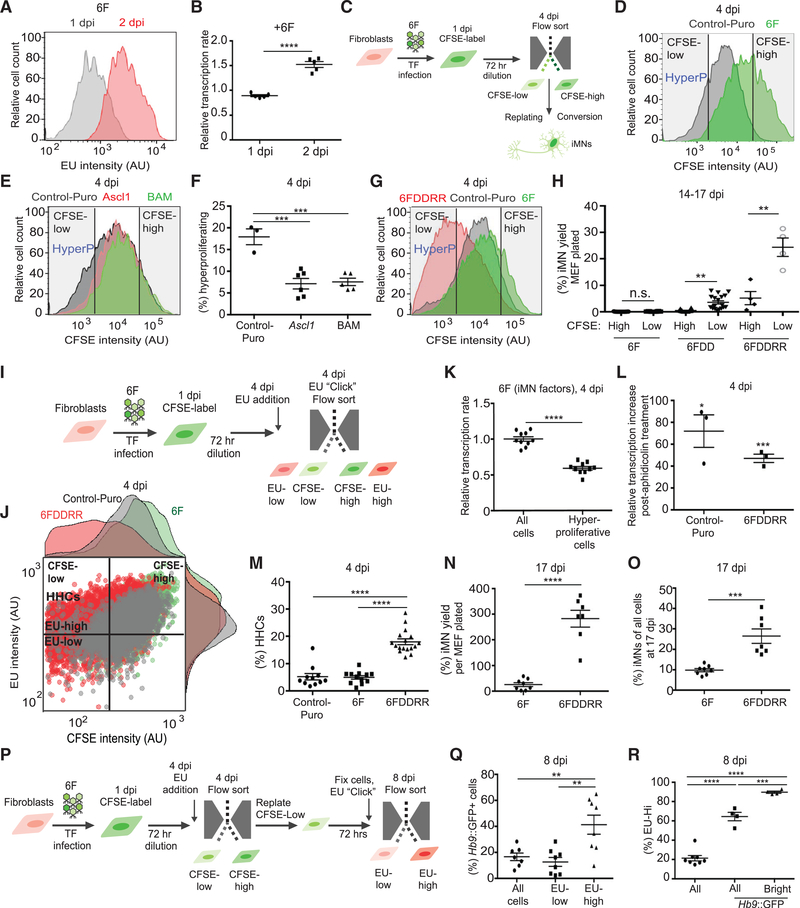
Figure 2. Hypertranscribing and Hyperproliferating Cells Drive Reprogramming.
(A) FACS plot showing relative EU incorporation in viable cells from 6F-infected MEF cultures at 1 and 2 dpi. Cell viability was determined by forward scatter (FSC) and side scatter (SSC) profiles in FACS analysis.
(B) Relative transcription rate measured by EU incorporation via flow cytometry at 1 and 2 dpi in 6F-infected MEFs compared to uninfected control. Mean EU intensity of non-transduced MEFs = 1. Only viable cells, determined by FSC and SSC profile via FACS, were analyzed. n = 5 independent transductions per condition. Mean ± SEM; unpaired t test.
(C) Schematic of CSFE-based flow sorting and replating of populations for reprogramming assays.
(D) CFSE intensity measured by flow cytometry at 4 dpi. “HyperP,” hyperproliferating cells, defined as cells showing a two-fold increase in division rate (an 8-fold decrease in CFSE intensity) compared to the average of Control-Puro MEFs.
(E) CFSE intensity measured by flow cytometry for Puro-infected cells (control), Ascl1-infected cells, or Brn2+Ascl1+Myt1l-infected cells (BAM) at 4 dpi.
(F) Effect of addition of Ascl1 or neuronal reprogramming factors BAM on the percentage of hyperproliferating cells measured by flow cytometry at 4 dpi. n = 3–6 independent transductions per condition. Mean ± SEM; one-way ANOVA.
(G) CFSE intensity measured by flow cytometry at 4 dpi with gates showing CFSE-low (HyperP) and CFSE-high. (H) Yield of iMNs from reprogramming populations sorted by CFSE intensity (CFSE-low and CFSE-high) at 4 dpi. Percent yield determined by counting total iMNs normalized by total number of cells counted per population at 4 dpi is shown. n = 4–23 independent conversions per condition. For 6F and 6FDD, median ± interquartile range and Mann-Whitney test between CFSE high and low groups in each transduction condition are shown. For 6FDDRR, mean ± SEM. Unpaired t test between CFSE high and low groups is shown.
(I) Schematic of CFSE-EU assay for measuring transcription and proliferation rates via flow cytometry at 4 dpi.
(J) Dot plot of CFSE intensity and fluorescently labeled EU for Control-Puro (gray), 6F (green), and 6FDDRR (red). Histograms of CFSE and EU intensity adjacent to dot plot are shown. Quadrant to demark HHCs set by reference to 6F condition is shown. Hyperproliferating and slow cycling cells set by selecting CFSE value in 6F condition to allow the dimmest 15% are shown. High EU values set by top half of 6F condition are shown, resulting in ~7% HHCs in 6F.
K) Relative transcription rate measured by EU incorporation via flow cytometry at 4 dpi of the whole population (all cells) of 6F-infected cells compared to hyperproliferative cells measured in 6F-infected MEFs. n = 10 independent transductions per condition. Mean ± SEM; one-way ANOVA.
(L) Percent relative transcription rate increase upon inhibition of DNA synthesis with aphidicolin treatment at 4 dpi. Relative transcription rate determined by difference between rates with and without aphidicolin treatment normalized to without for each transduction condition. n = 3 independent transductions per condition. Mean ± SEM; unpaired t test between with and without aphidicolin treatment for each transduction condition.
(M) Percentage of HHCs. n = 11–16 independent conversions per condition. Median ± interquartile range is shown; Kruskal-Wallis test.
(N) Yield of Hb9::GFP+ cells counted via flow cytometry at 17 dpi normalized to number of seeded cells. n = 7–8 independent conversions per condition. Mean ± SEM; unpaired t test.
(O) Yield of Hb9::GFP+ cells normalized to total cell number at 17 dpi. Cells were quantified via flow cytometry at 17 dpi. n = 7 or 8 independent conversions per condition. Mean ± SEM; unpaired t test.
(P) Schematic of CFSE-EU-pulse label assay to sort and label HHCs at 4 dpi followed by evaluation of Hb9::GFP intensity at 8 dpi.
(Q) Percentage of Hb9::GFP+ cells in 6FDDDR conditions for various gated populations. Cells gated for low EU intensity are shown. EU-low, cells with EU intensity in the lowest three quartiles, and EU-high, cells with EU intensity in the top quartile, at 8 dpi compared to all viable cells are shown, both EU-high and EU-low (all cells). Viable cells defined based on FSC and SSC profiles via FACS are shown. n = 7 or 8 independent conversions. Mean ± SEM; one-way ANOVA.
(R) Percentage of replated hyperproliferating cells in 6FDDRR conditions gated for high EU intensity (cells with EU intensity in the top quartile as measured by FACS) at 8 dpi. By definition, the whole viable population (all) contained 25% EU-Hi cells and Hb9::GFP+ and Hb9::GFP+ Bright cells (Hb9::GFP intensity in the top half of all viable Hb9+ cells) displayed enrichment of EU-high cells. n = 4–8 independent conversions. Median ± interquartile range is shown; Kruskal-Wallis test. Significance summary: p > 0.05 (ns); *p ≤ 0.05; **p ≤ 0.01; ***p ≤ 0.001; and ****p ≤ 0.0001.

