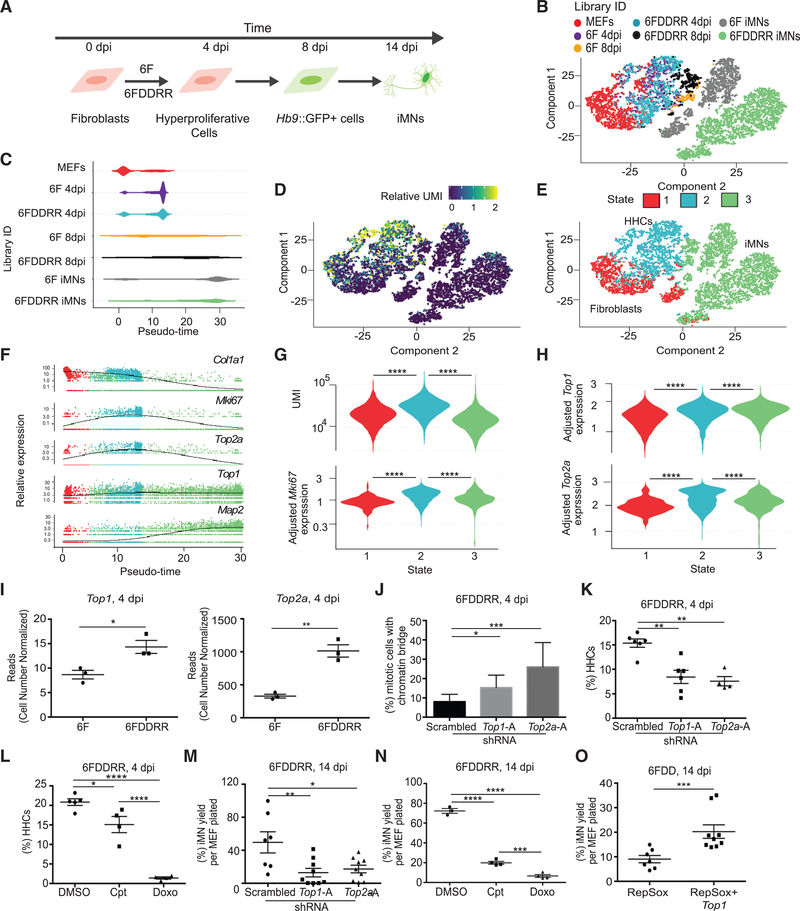
Figure 4. Topoisomerase Expression Enables Cells to Exhibit Both Hyperproliferation and Hypertranscription.
(A) Schematic of populations collected across conversion and profiled via single-cell RNA-seq. Individual libraries were prepared for MEFs (1,357 cells), hyperproliferating cells (CFSE-low) for 6F (1,174 cells) and 6FDDRR (1,189 cells) collected at 4 dpi (6F 4 dpi and 6FDDRR 4 dpi), and Hb9::GFP+ cells for 6F (259 cells) and 6FDDRR (406 cells) at 8 dpi (6F 8 dpi and 6FDDRR 8 dpi) and 6F iMNs (1,863 cells) and 6FDDRR iMNs (2,869 cells) at 14 dpi (iMNs).
(B) t-distributed stochastic neighbor embedding (tSNE) projection of all cells mapped during reprogramming colored by condition.
(C) Distribution of pseudotime across cells in each condition.
(D) Relative UMI distribution across cells.
(E) Clustering of three cellular states across the tSNE projection.
(F) Relative expression of Col1a1, Mki67, Top2a, Top1, and Map2 over pseudotime. Colors correspond to states identified in (E).
(G) Violin plot of UMI (top, unique molecular identifiers) and relative Mki67 expression (bottom) for clusters identified in (E).
(H) Violin plot of relative expression of Top1 (top) and Top2a (bottom) for clusters identified in (E).
(I) Reads from Top1 and Top2a quantified by cell number normalized (CNN) RNA-seq at 4 dpi.
(J) Percentage of mitotic anaphase-telophase cells with a chromatin bridge at 4 dpi for 6FDDRR conditions. n = 3 independent conversions per condition,n = 50–70 cells per condition. Percentage ± 95% confidence interval; chi-square test.
(K) Percentage of HHCs in 6FDDRR conditions. n = 4–6 independent conversions per condition. Mean ± SEM; one-way ANOVA.
(L) Percentage of HHCs in 6FDDRR conditions treated for 18 h with camptothecin (Cpt) or doxorubicin (Doxo) prior to 4 dpi compared to DMSO control. n = 4 or 5 independent conversions per condition. Mean ± SEM; one-way ANOVA.
(M) Yield of iMNs in 6DDDRR conditions at 14 dpi. n = 7–9 independent conversions per condition. Mean ± SEM; one-way ANOVA.
(N) Yield of iMNs at 14 dpi in 6FDDRR conditions treated for 18 h with Cpt or Doxo prior to 4 dpi compared to DMSO control. n = 3 or 4 independent conversions per condition. Mean ± SEM; one-way ANOVA.
(O) Yield of iMNs at 14 dpi in 6FDD condition treated with RepSox with or without Top1 overexpression. n = 7–9 independent conversions per condition. Mean ± SEM; unpaired t test.
Significance summary: p > 0.05 (ns); *p ≤ 0.05; **p ≤ 0.01; ***p ≤ 0.001; and ****p ≤ 0.0001.

